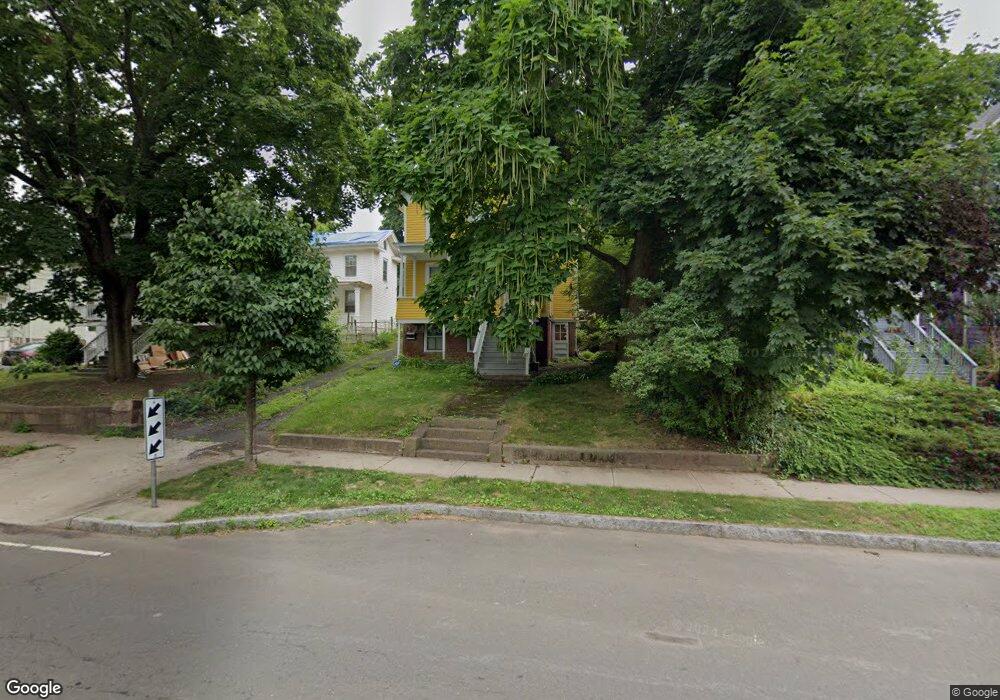
547 Quinnipiac Ave New Haven, CT 06513
Fair Haven Heights NeighborhoodEstimated Value: $287,945 - $352,000
3
Beds
1
Bath
1,352
Sq Ft
$229/Sq Ft
Est. Value
About This Home
This home is located at 547 Quinnipiac Ave, New Haven, CT 06513 and is currently estimated at $310,236, approximately $229 per square foot. 547 Quinnipiac Ave is a home located in New Haven County with nearby schools including Ross Woodward, St Francis & St Rose Of Lima School, and Cold Spring School.
Ownership History
Date
Name
Owned For
Owner Type
Purchase Details
Closed on
Feb 26, 2002
Sold by
Turner John P and Turner Cynthia C
Bought by
Baker David S and Begley Kate L
Current Estimated Value
Home Financials for this Owner
Home Financials are based on the most recent Mortgage that was taken out on this home.
Original Mortgage
$101,408
Outstanding Balance
$42,420
Interest Rate
7.08%
Estimated Equity
$267,816
Create a Home Valuation Report for This Property
The Home Valuation Report is an in-depth analysis detailing your home's value as well as a comparison with similar homes in the area
Home Values in the Area
Average Home Value in this Area
Purchase History
| Date | Buyer | Sale Price | Title Company |
|---|---|---|---|
| Baker David S | $103,000 | -- |
Source: Public Records
Mortgage History
| Date | Status | Borrower | Loan Amount |
|---|---|---|---|
| Open | Baker David S | $101,408 |
Source: Public Records
Tax History Compared to Growth
Tax History
| Year | Tax Paid | Tax Assessment Tax Assessment Total Assessment is a certain percentage of the fair market value that is determined by local assessors to be the total taxable value of land and additions on the property. | Land | Improvement |
|---|---|---|---|---|
| 2025 | $4,937 | $125,300 | $37,800 | $87,500 |
| 2024 | $4,824 | $125,300 | $37,800 | $87,500 |
| 2023 | $4,661 | $125,300 | $37,800 | $87,500 |
| 2022 | $4,981 | $125,300 | $37,800 | $87,500 |
| 2021 | $3,790 | $86,380 | $18,130 | $68,250 |
| 2020 | $3,790 | $86,380 | $18,130 | $68,250 |
| 2019 | $3,713 | $86,380 | $18,130 | $68,250 |
| 2018 | $3,713 | $86,380 | $18,130 | $68,250 |
| 2017 | $3,341 | $86,380 | $18,130 | $68,250 |
| 2016 | $3,900 | $93,870 | $27,230 | $66,640 |
| 2015 | $3,900 | $93,870 | $27,230 | $66,640 |
| 2014 | $3,900 | $93,870 | $27,230 | $66,640 |
Source: Public Records
Map
Nearby Homes
- 533 Quinnipiac Ave
- 265 Lexington Ave
- 314 Lenox St
- 8 Front St Unit D
- 76 Front St Unit 76
- 100 Front St Unit 100
- 43 E Pearl St
- 95 Lenox St Unit L
- 1 Front St Unit 1 Kel
- 674 Quinnipiac Ave
- 32 E Pearl St
- 33 Chapel St
- 71 Houston St
- 121 Lexington Ave Unit 21
- 191 Ferry St
- 714 Quinnipiac Ave
- 116 E Pearl St
- 72 Pierpont St
- 12 E Ferry St
- 728 Quinnipiac Ave
- 543 Quinnipiac Ave
- 553 Quinnipiac Ave
- 539 Quinnipiac Ave
- 539 Quinnipiac Ave Unit 1
- 537 Quinnipiac Ave
- 17 Aner St
- 561 Quinnipiac Ave
- 535 Quinnipiac Ave
- 535 Quinnipiac Ave Unit 3
- 535 Quinnipiac Ave Unit 2
- 535 Quinnipiac Ave Unit 1
- 535 Quinnipiac Ave Unit 3rd
- 565 Quinnipiac Ave
- 232 Lenox St
- 220 Lenox St
- 529 Quinnipiac Ave
- 238 Lenox St
- 571 Quinnipiac Ave
- 210 Lenox St
- 525 Quinnipiac Ave