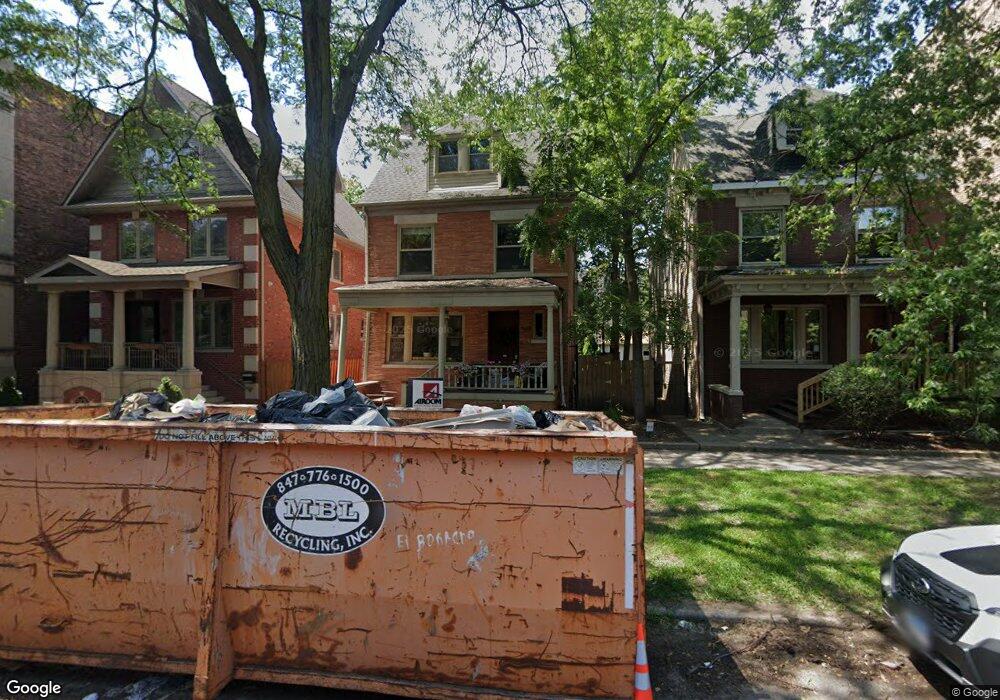
5472 S Ellis Ave Chicago, IL 60615
Hyde Park NeighborhoodEstimated Value: $960,000 - $2,082,000
5
Beds
4
Baths
3,459
Sq Ft
$411/Sq Ft
Est. Value
About This Home
This home is located at 5472 S Ellis Ave, Chicago, IL 60615 and is currently estimated at $1,421,937, approximately $411 per square foot. 5472 S Ellis Ave is a home located in Cook County with nearby schools including Kozminski Community Academy, Kenwood Academy High School, and St. Thomas the Apostle Elementary School.
Ownership History
Date
Name
Owned For
Owner Type
Purchase Details
Closed on
Sep 21, 2017
Sold by
Ponce Holt Janet A and Ponce De Leon Saul
Bought by
Esser Kahn Aaron P and Bychawski Jessica E
Current Estimated Value
Home Financials for this Owner
Home Financials are based on the most recent Mortgage that was taken out on this home.
Original Mortgage
$935,200
Outstanding Balance
$777,790
Interest Rate
3.75%
Mortgage Type
New Conventional
Estimated Equity
$644,147
Purchase Details
Closed on
Jun 22, 2007
Sold by
Holt Janet A
Bought by
Ponce Holt Janet A and Ponce De Leon Saul
Purchase Details
Closed on
Feb 2, 2004
Sold by
Fowler Michael Q and Fowler Yolanda E
Bought by
Holt Janet A
Home Financials for this Owner
Home Financials are based on the most recent Mortgage that was taken out on this home.
Original Mortgage
$244,000
Interest Rate
6.12%
Mortgage Type
Unknown
Create a Home Valuation Report for This Property
The Home Valuation Report is an in-depth analysis detailing your home's value as well as a comparison with similar homes in the area
Home Values in the Area
Average Home Value in this Area
Purchase History
| Date | Buyer | Sale Price | Title Company |
|---|---|---|---|
| Esser Kahn Aaron P | $1,169,000 | Chicago Title | |
| Ponce Holt Janet A | -- | Netco | |
| Holt Janet A | $305,000 | Professional National Title |
Source: Public Records
Mortgage History
| Date | Status | Borrower | Loan Amount |
|---|---|---|---|
| Open | Esser Kahn Aaron P | $935,200 | |
| Previous Owner | Holt Janet A | $244,000 |
Source: Public Records
Tax History Compared to Growth
Tax History
| Year | Tax Paid | Tax Assessment Tax Assessment Total Assessment is a certain percentage of the fair market value that is determined by local assessors to be the total taxable value of land and additions on the property. | Land | Improvement |
|---|---|---|---|---|
| 2024 | $13,987 | $96,996 | $33,517 | $63,479 |
| 2023 | $13,564 | $69,369 | $27,030 | $42,339 |
| 2022 | $13,564 | $69,369 | $27,030 | $42,339 |
| 2021 | $15,216 | $79,000 | $27,030 | $51,970 |
| 2020 | $18,274 | $85,133 | $21,624 | $63,509 |
| 2019 | $17,903 | $92,536 | $21,624 | $70,912 |
| 2018 | $21,352 | $108,095 | $21,624 | $86,471 |
| 2017 | $15,976 | $77,588 | $17,839 | $59,749 |
| 2016 | $15,040 | $77,588 | $17,839 | $59,749 |
| 2015 | $14,961 | $84,268 | $17,839 | $66,429 |
| 2014 | $10,119 | $57,108 | $14,596 | $42,512 |
| 2013 | $9,908 | $57,108 | $14,596 | $42,512 |
Source: Public Records
Map
Nearby Homes
- 5469 S Ingleside Ave Unit 2N
- 5459 S Ingleside Ave Unit 5459
- 5455 S Ingleside Ave Unit 5455
- 1006 E 54th St Unit J-2
- 222-226 E 56th St
- 5252 S Drexel Ave Unit 3A
- 5517 S University Ave Unit 1
- 5239 S Ingleside Ave
- 1000 E 53rd St Unit 119S
- 1157 E 56th St Unit 3
- 5223 S Drexel Ave Unit 2N
- 5230 S University Ave Unit D
- 5200 S Ellis Ave Unit 202
- 5200 S Ellis Ave Unit 508
- 5312 S Woodlawn Ave Unit 1
- 5626 S Woodlawn Ave
- 5235 S University Ave
- 5638 S Woodlawn Ave
- 5408 S Kimbark Ave
- 5229 S University Ave
- 5476 S Ellis Ave
- 5478 S Ellis Ave Unit 80
- 5467 S Ingleside Ave Unit 1W
- 5467 S Ingleside Ave Unit 5467
- 5467 S Ingleside Ave Unit 5467
- 5467 S Ingleside Ave Unit 5467
- 5467 S Ingleside Ave Unit 5467
- 5467 S Ingleside Ave Unit 5467
- 5467 S Ingleside Ave Unit 5467
- 5467 S Ingleside Ave Unit 3W
- 5467 S Ingleside Ave Unit 1E
- 5467 S Ingleside Ave Unit 3E
- 5467 S Ingleside Ave Unit 2W
- 5467 S Ingleside Ave Unit 2E
- 5469 S Ingleside Ave Unit 5469
- 5469 S Ingleside Ave Unit 5469
- 5469 S Ingleside Ave Unit 5469
- 5469 S Ingleside Ave Unit 5469
- 5469 S Ingleside Ave Unit 5469
- 5469 S Ingleside Ave Unit 5469