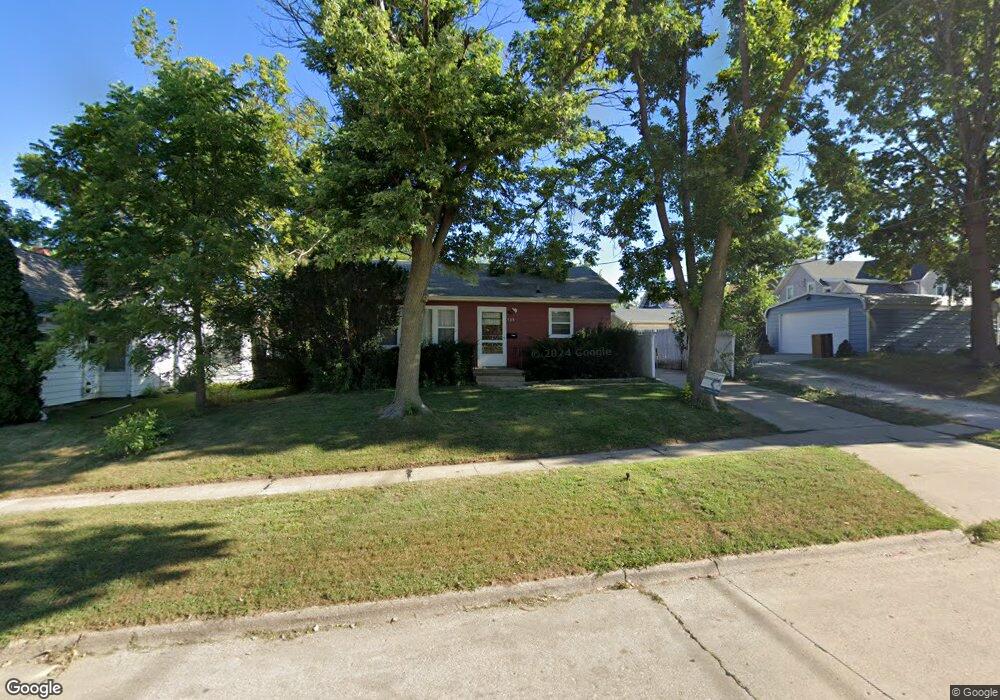
548 10th Ave Marion, IA 52302
Estimated Value: $129,761 - $150,000
2
Beds
1
Bath
720
Sq Ft
$191/Sq Ft
Est. Value
About This Home
This home is located at 548 10th Ave, Marion, IA 52302 and is currently estimated at $137,440, approximately $190 per square foot. 548 10th Ave is a home located in Linn County with nearby schools including Longfellow Elementary, Francis Marion Intermediate School, and Vernon Middle School.
Ownership History
Date
Name
Owned For
Owner Type
Purchase Details
Closed on
Nov 11, 2003
Sold by
Oneil Dana K and Oneil Patrick W
Bought by
Janish Michael W
Current Estimated Value
Home Financials for this Owner
Home Financials are based on the most recent Mortgage that was taken out on this home.
Original Mortgage
$78,570
Outstanding Balance
$35,944
Interest Rate
5.81%
Mortgage Type
Purchase Money Mortgage
Estimated Equity
$101,496
Purchase Details
Closed on
Oct 31, 2002
Sold by
Hallock Susan L
Bought by
Cable Dana K
Home Financials for this Owner
Home Financials are based on the most recent Mortgage that was taken out on this home.
Original Mortgage
$73,420
Interest Rate
6.13%
Mortgage Type
FHA
Create a Home Valuation Report for This Property
The Home Valuation Report is an in-depth analysis detailing your home's value as well as a comparison with similar homes in the area
Home Values in the Area
Average Home Value in this Area
Purchase History
| Date | Buyer | Sale Price | Title Company |
|---|---|---|---|
| Janish Michael W | $80,500 | -- | |
| Cable Dana K | $111,000 | -- |
Source: Public Records
Mortgage History
| Date | Status | Borrower | Loan Amount |
|---|---|---|---|
| Open | Janish Michael W | $78,570 | |
| Previous Owner | Cable Dana K | $73,420 |
Source: Public Records
Tax History
| Year | Tax Paid | Tax Assessment Tax Assessment Total Assessment is a certain percentage of the fair market value that is determined by local assessors to be the total taxable value of land and additions on the property. | Land | Improvement |
|---|---|---|---|---|
| 2025 | $1,478 | $114,500 | $12,800 | $101,700 |
| 2024 | $2,052 | $89,200 | $12,800 | $76,400 |
| 2023 | $2,052 | $89,200 | $12,800 | $76,400 |
| 2022 | $1,980 | $101,100 | $12,800 | $88,300 |
| 2021 | $1,796 | $101,100 | $12,800 | $88,300 |
| 2020 | $1,796 | $88,000 | $12,800 | $75,200 |
| 2019 | $1,800 | $88,400 | $17,500 | $70,900 |
Source: Public Records
Map
Nearby Homes
Your Personal Tour Guide
Ask me questions while you tour the home.