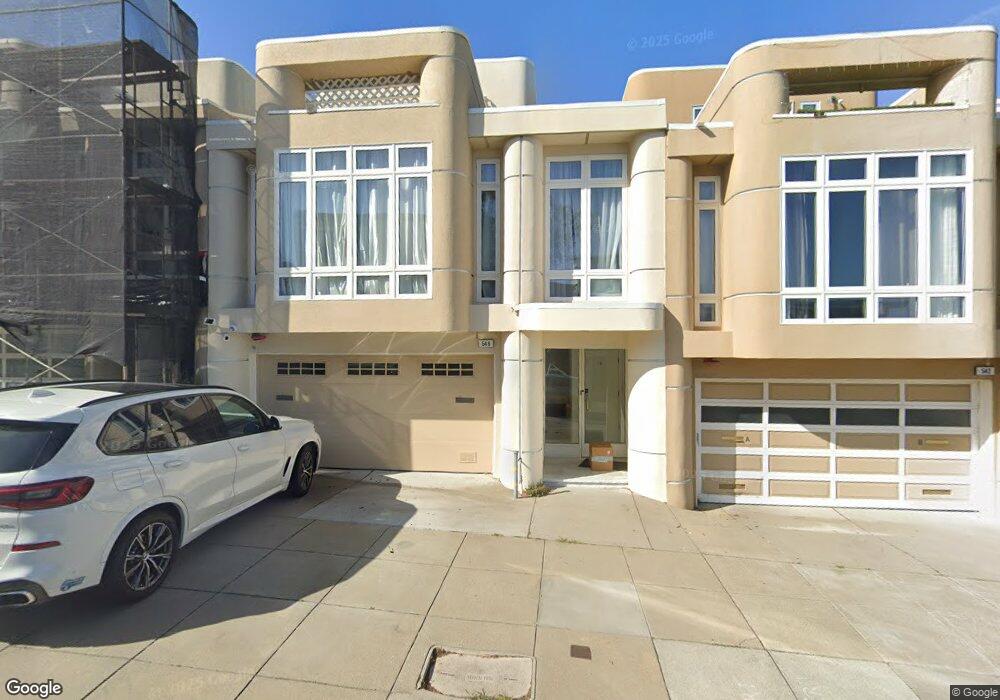
548 Duncan St Unit 101 San Francisco, CA 94131
Noe Valley NeighborhoodEstimated Value: $1,831,000 - $1,913,000
3
Beds
3
Baths
1,705
Sq Ft
$1,098/Sq Ft
Est. Value
About This Home
This home is located at 548 Duncan St Unit 101, San Francisco, CA 94131 and is currently estimated at $1,871,967, approximately $1,097 per square foot. 548 Duncan St Unit 101 is a home located in San Francisco County with nearby schools including Alvarado Elementary, James Lick Middle School, and St. Philip School.
Ownership History
Date
Name
Owned For
Owner Type
Purchase Details
Closed on
Jan 14, 2024
Sold by
Hoerni John
Bought by
John A Hoerni Trust and Hoerni
Current Estimated Value
Purchase Details
Closed on
Oct 14, 2009
Sold by
Vander Geest Olaf M
Bought by
Hoerni John
Purchase Details
Closed on
Sep 12, 2000
Sold by
Rofsky Mitchell A
Bought by
Vandergeest Olaf M
Home Financials for this Owner
Home Financials are based on the most recent Mortgage that was taken out on this home.
Original Mortgage
$325,000
Interest Rate
8.12%
Purchase Details
Closed on
Aug 17, 2000
Sold by
Cheap Margaret A
Bought by
Rofsky Mitchell A
Home Financials for this Owner
Home Financials are based on the most recent Mortgage that was taken out on this home.
Original Mortgage
$325,000
Interest Rate
8.12%
Create a Home Valuation Report for This Property
The Home Valuation Report is an in-depth analysis detailing your home's value as well as a comparison with similar homes in the area
Home Values in the Area
Average Home Value in this Area
Purchase History
| Date | Buyer | Sale Price | Title Company |
|---|---|---|---|
| John A Hoerni Trust | -- | None Listed On Document | |
| Hoerni John | $1,025,000 | Chicago Title Company | |
| Vandergeest Olaf M | $760,000 | First American Title Co | |
| Rofsky Mitchell A | -- | First American Title Co |
Source: Public Records
Mortgage History
| Date | Status | Borrower | Loan Amount |
|---|---|---|---|
| Previous Owner | Vandergeest Olaf M | $325,000 |
Source: Public Records
Tax History
| Year | Tax Paid | Tax Assessment Tax Assessment Total Assessment is a certain percentage of the fair market value that is determined by local assessors to be the total taxable value of land and additions on the property. | Land | Improvement |
|---|---|---|---|---|
| 2025 | $15,984 | $1,323,082 | $661,541 | $661,541 |
| 2024 | $15,984 | $1,297,140 | $648,570 | $648,570 |
| 2023 | $15,743 | $1,271,706 | $635,853 | $635,853 |
| 2022 | $15,441 | $1,246,772 | $623,386 | $623,386 |
| 2021 | $15,699 | $1,222,326 | $611,163 | $611,163 |
| 2020 | $16,029 | $1,209,794 | $604,897 | $604,897 |
| 2019 | $14,972 | $1,186,074 | $593,037 | $593,037 |
| 2018 | $14,222 | $1,162,818 | $581,409 | $581,409 |
| 2017 | $13,756 | $1,140,018 | $570,009 | $570,009 |
| 2016 | $13,532 | $1,117,666 | $558,833 | $558,833 |
| 2015 | $13,364 | $1,100,878 | $550,439 | $550,439 |
| 2014 | $13,013 | $1,079,314 | $539,657 | $539,657 |
Source: Public Records
Map
Nearby Homes
- 479 28th St
- 356-358 Day St
- 375 Day St
- 301 Day St
- 438 30th St
- 636 28th St
- 1485 Church St Unit 4
- 3864 Cesar Chavez St
- 5330 Diamond Heights Blvd Unit J301
- 5320 Diamond Heights Blvd Unit 202K
- 101 28th St
- 1840 Church St Unit 1842
- 12 Chenery St
- 1479 Dolores St
- 45 Ora Way Unit A303
- 45 Ora Way Unit 204A
- 37 Miguel St Unit 6
- 1060 Noe St Unit 1060A
- 1060 Noe St Unit 1062
- 3763 Cesar Chavez
- 548 Duncan St Unit 201
- 542 Duncan St Unit 201
- 542A Duncan St Unit 201
- 542 Duncan St Unit 101
- 554 Duncan St
- 538 Duncan St
- 560 Duncan St
- 566A Duncan St Unit 1
- 566 Duncan St Unit A
- 566 Duncan St Unit 1
- 566 Duncan St
- 526 Duncan St
- 555 27th St Unit 3
- 555 27th St Unit 2
- 555 27th St Unit 1
- 557 27th St Unit 1
- 557 27th St Unit IT1
- 557 27th St Unit 3
- 557 27th St Unit 2
- 549 Duncan St Unit A