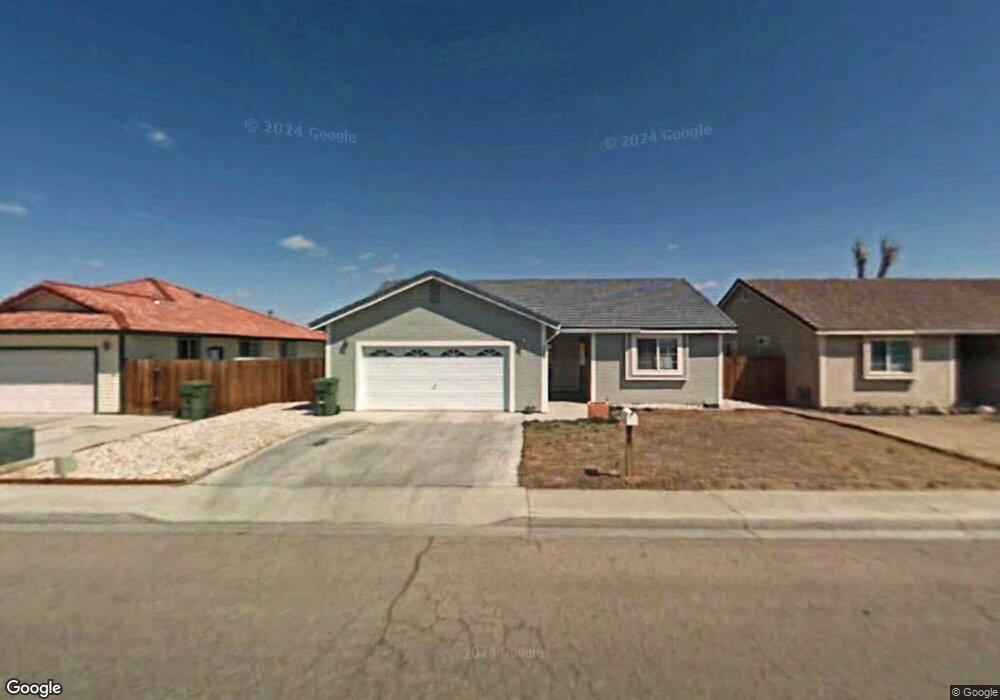
548 Venturacci Ln Fallon, NV 89406
Estimated Value: $333,000 - $428,000
3
Beds
2
Baths
1,350
Sq Ft
$270/Sq Ft
Est. Value
About This Home
This home is located at 548 Venturacci Ln, Fallon, NV 89406 and is currently estimated at $365,119, approximately $270 per square foot. 548 Venturacci Ln is a home located in Churchill County with nearby schools including Lahontan Elementary School, E.C. Best Elementary School, and Numa Elementary School.
Ownership History
Date
Name
Owned For
Owner Type
Purchase Details
Closed on
Jan 31, 2019
Sold by
Ching Alexander and Ching Stella
Bought by
Banks Christopher
Current Estimated Value
Home Financials for this Owner
Home Financials are based on the most recent Mortgage that was taken out on this home.
Original Mortgage
$196,377
Outstanding Balance
$171,810
Interest Rate
4.46%
Estimated Equity
$193,309
Purchase Details
Closed on
Jan 15, 2019
Sold by
Ching Alexander and Ching Stella
Bought by
Banks Christopher
Home Financials for this Owner
Home Financials are based on the most recent Mortgage that was taken out on this home.
Original Mortgage
$196,377
Outstanding Balance
$171,810
Interest Rate
4.46%
Estimated Equity
$193,309
Purchase Details
Closed on
May 23, 2005
Sold by
Proctor Richard Gordy and Proctor Sharon H
Bought by
Ching Alexander and Ching Stella
Home Financials for this Owner
Home Financials are based on the most recent Mortgage that was taken out on this home.
Original Mortgage
$90,000
Interest Rate
5.72%
Create a Home Valuation Report for This Property
The Home Valuation Report is an in-depth analysis detailing your home's value as well as a comparison with similar homes in the area
Home Values in the Area
Average Home Value in this Area
Purchase History
| Date | Buyer | Sale Price | Title Company |
|---|---|---|---|
| Banks Christopher | $200,000 | Western Nv Title | |
| Banks Christopher | $200,000 | Western Nv Title | |
| Banks Christopher | $200,000 | Western Nevada Title Co | |
| Ching Alexander | $165,000 | Western Nevada Title Company |
Source: Public Records
Mortgage History
| Date | Status | Borrower | Loan Amount |
|---|---|---|---|
| Open | Banks Christopher | $196,377 | |
| Closed | Banks Christopher | $196,377 | |
| Closed | Banks Christopher | $196,377 | |
| Previous Owner | Ching Alexander | $90,000 |
Source: Public Records
Tax History
| Year | Tax Paid | Tax Assessment Tax Assessment Total Assessment is a certain percentage of the fair market value that is determined by local assessors to be the total taxable value of land and additions on the property. | Land | Improvement |
|---|---|---|---|---|
| 2025 | $2,070 | $76,030 | $21,700 | $54,330 |
| 2024 | $2,070 | $74,905 | $19,950 | $54,955 |
| 2023 | $2,070 | $71,560 | $19,950 | $51,610 |
| 2022 | $1,948 | $56,785 | $11,900 | $44,885 |
| 2021 | $1,803 | $55,640 | $11,900 | $43,740 |
| 2020 | $1,723 | $52,413 | $11,900 | $40,513 |
| 2019 | $1,673 | $51,514 | $11,900 | $39,614 |
| 2018 | $636 | $50,621 | $11,900 | $38,721 |
| 2017 | $592 | $49,345 | $10,500 | $38,845 |
| 2016 | $1,043 | $44,617 | $7,875 | $36,742 |
| 2015 | $1,022 | $40,401 | $7,875 | $32,526 |
| 2014 | $992 | $37,729 | $7,875 | $29,854 |
Source: Public Records
Map
Nearby Homes
- 530 Michael Dr
- 641 Megan Way
- 775 Karry Way
- 806 Karry Way
- 285 Amanda Ln
- 1141 Alder Dr
- 119 Toiyabe Ln
- 1755 Coleman Rd
- 800 Great Basin Ln
- 90 S Allen St
- 815 Great Basin Ln
- 882 Great Basin Ln
- 621 Keppel St
- 126 S Laverne St
- 681 Keppel St
- 009-291-74 00929174
- 250 S Taylor St
- 604 Keppel St
- 618 Keppel St
- 728 Keppel St
- 562 Venturacci Ln
- 536 Venturacci Ln
- 521 Michael Dr
- 531 Michael Dr
- 524 Venturacci Ln
- 574 Venturacci Ln
- 511 Michael Dr
- 543 Venturacci Ln Unit 8
- 555 Venturacci Ln
- 501 Michael Dr
- 586 Venturacci Ln
- 512 Venturacci Ln
- 569 Venturacci Ln
- 551 Michael Dr
- 517 Venturacci Ln
- 471 Michael Dr
- 583 Venturacci Ln
- 496 Venturacci Ln
- 598 Venturacci Ln Unit 8
- 501 Venturacci Ln
Your Personal Tour Guide
Ask me questions while you tour the home.