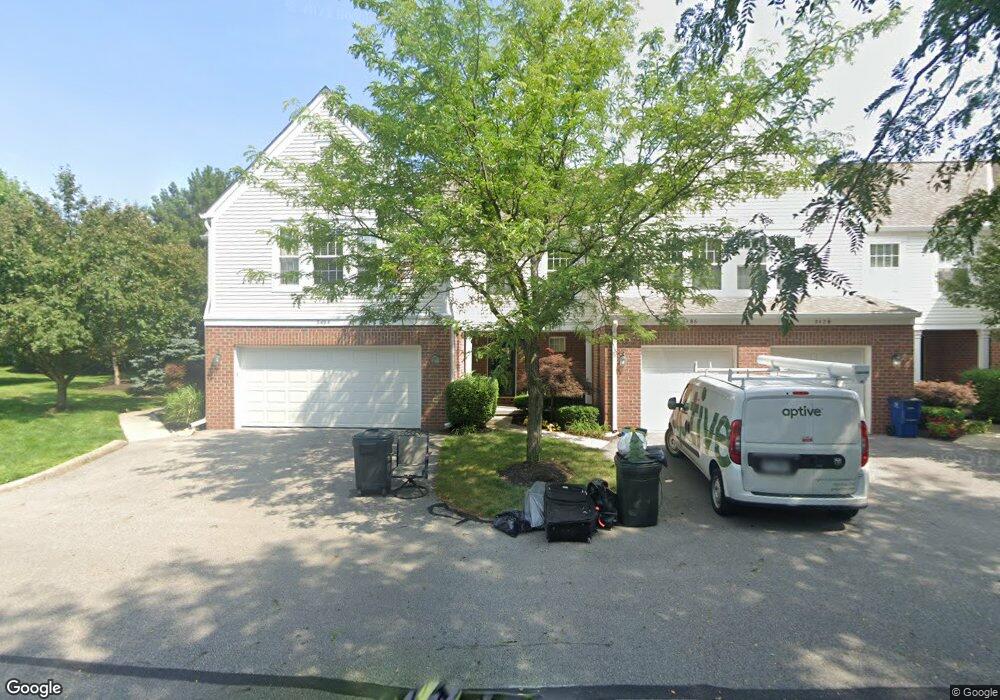
5486 Aubrey Loop Dublin, OH 43016
Tuttle West NeighborhoodEstimated Value: $268,000 - $343,000
2
Beds
4
Baths
1,354
Sq Ft
$216/Sq Ft
Est. Value
About This Home
This home is located at 5486 Aubrey Loop, Dublin, OH 43016 and is currently estimated at $292,089, approximately $215 per square foot. 5486 Aubrey Loop is a home located in Franklin County with nearby schools including Indian Run Elementary School, John Sells Middle School, and Dublin Coffman High School.
Ownership History
Date
Name
Owned For
Owner Type
Purchase Details
Closed on
Nov 10, 2020
Sold by
Sberna Mary P and Sberna Mary Pait
Bought by
Sberna Mary Pat and Mary Pat Sberna Revocable Living Trust
Current Estimated Value
Purchase Details
Closed on
Dec 27, 2002
Sold by
Sberna Jane A
Bought by
Sberna Mary P
Home Financials for this Owner
Home Financials are based on the most recent Mortgage that was taken out on this home.
Original Mortgage
$142,500
Outstanding Balance
$60,092
Interest Rate
6.37%
Mortgage Type
Purchase Money Mortgage
Estimated Equity
$231,997
Purchase Details
Closed on
Aug 31, 2000
Sold by
Wolfe Bruce E and Wolfe Jill E
Bought by
Sberna Jane A
Home Financials for this Owner
Home Financials are based on the most recent Mortgage that was taken out on this home.
Original Mortgage
$106,000
Interest Rate
7.87%
Mortgage Type
Purchase Money Mortgage
Create a Home Valuation Report for This Property
The Home Valuation Report is an in-depth analysis detailing your home's value as well as a comparison with similar homes in the area
Home Values in the Area
Average Home Value in this Area
Purchase History
| Date | Buyer | Sale Price | Title Company |
|---|---|---|---|
| Sberna Mary Pat | -- | None Available | |
| Sberna Mary P | $150,000 | -- | |
| Sberna Jane A | $132,500 | Chicago Title |
Source: Public Records
Mortgage History
| Date | Status | Borrower | Loan Amount |
|---|---|---|---|
| Open | Sberna Mary P | $142,500 | |
| Closed | Sberna Jane A | $106,000 |
Source: Public Records
Tax History
| Year | Tax Paid | Tax Assessment Tax Assessment Total Assessment is a certain percentage of the fair market value that is determined by local assessors to be the total taxable value of land and additions on the property. | Land | Improvement |
|---|---|---|---|---|
| 2025 | $5,519 | $84,950 | $16,450 | $68,500 |
| 2024 | $5,519 | $84,950 | $16,450 | $68,500 |
| 2023 | $5,443 | $84,945 | $16,450 | $68,495 |
| 2022 | $4,279 | $61,050 | $9,210 | $51,840 |
| 2021 | $4,289 | $61,050 | $9,210 | $51,840 |
| 2020 | $4,325 | $61,050 | $9,210 | $51,840 |
| 2019 | $3,911 | $48,830 | $7,350 | $41,480 |
| 2018 | $3,827 | $48,830 | $7,350 | $41,480 |
| 2017 | $3,640 | $48,830 | $7,350 | $41,480 |
| 2016 | $3,701 | $46,620 | $9,450 | $37,170 |
| 2015 | $3,725 | $46,620 | $9,450 | $37,170 |
| 2014 | $3,730 | $46,620 | $9,450 | $37,170 |
| 2013 | $2,109 | $51,800 | $10,500 | $41,300 |
Source: Public Records
Map
Nearby Homes
- 6178 Turvey Loop W Unit 6178
- 5006 Ivyvine Blvd Unit 5006
- 5176 Clarewood Ln
- 4801 Rays Cir SW Unit 4801
- 4969 Ivyvine Blvd Unit 4969
- 6293 Hampton Green Place Unit 12C
- 5022 Vinington Place Unit 5022
- 4908 Ashleigh Dr Unit 4908
- 5752 Caulfield Ln Unit 25
- 6258 Cartwright Ln N
- 5744 Caulfield Ln
- 4812 Ashleigh Dr
- 5145 Vinings Blvd Unit B
- 6280 Cartwright Ln N
- 5127 Vinings Blvd Unit 5127
- 5471 Bonanza Ln
- 5444 Carson City Ln
- 0 Riggins Rd
- 5804 Oldenburgh Way
- 4222 Bradhurst Dr Unit 15
- 5494 Aubrey Loop
- 5494 Aubrey Loop Unit 1
- 5478 Aubrey Loop Unit 5478
- 5478 Aubrey Loop Unit 1-5478
- 5470 Aubrey Loop Unit 5470
- 5425 Crossing Ln Unit 5425
- 5425 Crossing Ln Unit 12
- 5809 Locbury Ln
- 5433 Crossing Ln Unit 5433
- 5462 Aubrey Loop Unit 5462
- 5429 Aubrey Loop
- 5429 Aubrey Loop Unit 3-5429
- 5441 Crossing Ln Unit 5441
- 5805 Locbury Ln
- 5454 Aubrey Loop Unit 5454
- 5398 Crossing Ln Unit 5398
- 5825 Locbury Ln Unit R5825
- 5421 Aubrey Loop Unit 5421
- 5401 Crossing Ln
- 5401 Crossing Ln Unit 11
Your Personal Tour Guide
Ask me questions while you tour the home.