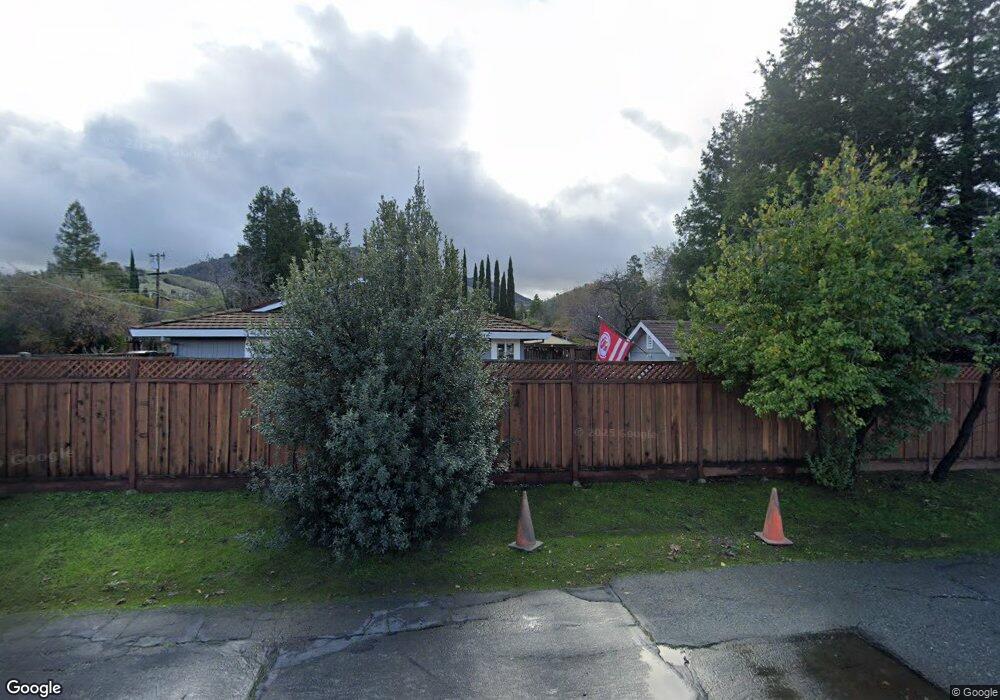
5486 Pine Hollow Rd Concord, CA 94521
The Highlands NeighborhoodEstimated Value: $1,167,000 - $1,648,000
--
Bed
--
Bath
2,531
Sq Ft
$560/Sq Ft
Est. Value
About This Home
This home is located at 5486 Pine Hollow Rd, Concord, CA 94521 and is currently estimated at $1,417,274, approximately $559 per square foot. 5486 Pine Hollow Rd is a home located in Contra Costa County with nearby schools including Highlands Elementary School, Mt. Diablo Elementary School, and Pine Hollow Middle School.
Ownership History
Date
Name
Owned For
Owner Type
Purchase Details
Closed on
Feb 18, 2015
Sold by
Ceizler Dawn
Bought by
Ceizler Dawn
Current Estimated Value
Purchase Details
Closed on
May 5, 2014
Sold by
Mangini Sherry L
Bought by
Ceizler Dawn
Home Financials for this Owner
Home Financials are based on the most recent Mortgage that was taken out on this home.
Original Mortgage
$762,160
Outstanding Balance
$581,289
Interest Rate
4.35%
Mortgage Type
New Conventional
Estimated Equity
$835,985
Purchase Details
Closed on
Sep 6, 2012
Sold by
Mangini Sherry L
Bought by
Mangini Sherry L
Purchase Details
Closed on
Mar 12, 2001
Sold by
Pulte Home Corp
Bought by
Mangini Joseph A and Mangini Sherry L
Purchase Details
Closed on
Sep 19, 1995
Sold by
Mangini Joseph A and Mangini Sherry L
Bought by
Mangini Joseph A and Mangini Sherry L
Create a Home Valuation Report for This Property
The Home Valuation Report is an in-depth analysis detailing your home's value as well as a comparison with similar homes in the area
Home Values in the Area
Average Home Value in this Area
Purchase History
| Date | Buyer | Sale Price | Title Company |
|---|---|---|---|
| Ceizler Dawn | -- | None Available | |
| Ceizler Dawn | $953,000 | Fidelity National Title Co | |
| Mangini Sherry L | -- | None Available | |
| Mangini Joseph A | -- | First American Title Guarant | |
| Mangini Joseph A | -- | -- |
Source: Public Records
Mortgage History
| Date | Status | Borrower | Loan Amount |
|---|---|---|---|
| Open | Ceizler Dawn | $762,160 |
Source: Public Records
Tax History Compared to Growth
Tax History
| Year | Tax Paid | Tax Assessment Tax Assessment Total Assessment is a certain percentage of the fair market value that is determined by local assessors to be the total taxable value of land and additions on the property. | Land | Improvement |
|---|---|---|---|---|
| 2025 | $14,219 | $1,338,235 | $718,351 | $619,884 |
| 2024 | $12,495 | $1,285,329 | $704,266 | $581,063 |
| 2023 | $12,495 | $1,122,872 | $690,457 | $432,415 |
| 2022 | $12,387 | $1,100,856 | $676,919 | $423,937 |
| 2021 | $12,129 | $1,079,272 | $663,647 | $415,625 |
| 2019 | $11,936 | $1,047,263 | $643,964 | $403,299 |
| 2018 | $11,517 | $1,026,730 | $631,338 | $395,392 |
| 2017 | $11,177 | $1,006,599 | $618,959 | $387,640 |
| 2016 | $10,936 | $986,863 | $606,823 | $380,040 |
| 2015 | $10,899 | $972,040 | $597,708 | $374,332 |
| 2014 | $3,993 | $349,497 | $83,141 | $266,356 |
Source: Public Records
Map
Nearby Homes
- 1152 Via Doble
- 5485 Florida Dr
- 1116 Vista Point Ln
- 1341 Maryland Dr
- 5540 Michigan Blvd
- 1271 Kentucky Dr
- 5549 Pennsylvania Blvd
- 5391 Fernbank Dr
- 1288 Kentucky Dr
- 5350 Fernbank Dr Unit 1
- 868 Deer Spring Cir
- 5506 Alaska Dr
- 5503 Nebraska Dr
- 1370 Washington Blvd
- 5501 Nebraska Dr
- 1012 Barkwood Ct
- 1120 Kenwal Rd Unit C
- 7 Atchinson Stage Rd
- 50 Nottingham Place
- 1498 Delaware Dr