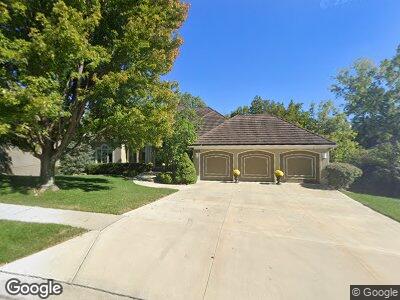
5489 NE Northgate Crossing Lees Summit, MO 64064
Chapel Ridge NeighborhoodEstimated Value: $552,000 - $778,000
4
Beds
5
Baths
2,550
Sq Ft
$263/Sq Ft
Est. Value
About This Home
This home is located at 5489 NE Northgate Crossing, Lees Summit, MO 64064 and is currently estimated at $670,583, approximately $262 per square foot. 5489 NE Northgate Crossing is a home located in Jackson County with nearby schools including Chapel Lakes Elementary School, Delta Woods Middle School, and Blue Springs South High School.
Ownership History
Date
Name
Owned For
Owner Type
Purchase Details
Closed on
Aug 19, 2013
Sold by
Goodman Vernon G and Goodman Donna J
Bought by
Goodman David S and Hogle Julie Goodman
Current Estimated Value
Purchase Details
Closed on
Nov 11, 2004
Sold by
Gregg Jeffrey G and Gregg Marcy
Bought by
Goodman Vernon G and Goodman Donna J
Home Financials for this Owner
Home Financials are based on the most recent Mortgage that was taken out on this home.
Original Mortgage
$50,000
Interest Rate
5.68%
Mortgage Type
Credit Line Revolving
Purchase Details
Closed on
Aug 28, 1998
Sold by
Sue Allen Jennifer and Sue Brian
Bought by
Gregg Jeffrey G and Gregg Marcy
Home Financials for this Owner
Home Financials are based on the most recent Mortgage that was taken out on this home.
Original Mortgage
$392,400
Interest Rate
6.9%
Mortgage Type
Purchase Money Mortgage
Purchase Details
Closed on
Dec 20, 1995
Sold by
Allen Dennis Dean
Bought by
Allen Jennifer Sue
Create a Home Valuation Report for This Property
The Home Valuation Report is an in-depth analysis detailing your home's value as well as a comparison with similar homes in the area
Home Values in the Area
Average Home Value in this Area
Purchase History
| Date | Buyer | Sale Price | Title Company |
|---|---|---|---|
| Goodman Vernon G | -- | Accurate Title Co | |
| Gregg Jeffrey G | -- | -- | |
| Allen Jennifer Sue | -- | -- |
Source: Public Records
Mortgage History
| Date | Status | Borrower | Loan Amount |
|---|---|---|---|
| Open | Goodman Vernon G | $100,000 | |
| Open | Goodman Vernon G | $300,000 | |
| Closed | Goodman Vern G | $100,000 | |
| Closed | Goodman Vernon G | $200,000 | |
| Closed | Goodman Vernon G | $50,000 | |
| Closed | Goodman Vernon G | $333,700 | |
| Previous Owner | Gregg Jeffrey G | $392,400 |
Source: Public Records
Tax History Compared to Growth
Tax History
| Year | Tax Paid | Tax Assessment Tax Assessment Total Assessment is a certain percentage of the fair market value that is determined by local assessors to be the total taxable value of land and additions on the property. | Land | Improvement |
|---|---|---|---|---|
| 2024 | $8,573 | $114,000 | $19,239 | $94,761 |
| 2023 | $8,573 | $114,000 | $16,389 | $97,611 |
| 2022 | $9,794 | $115,330 | $12,968 | $102,362 |
| 2021 | $9,785 | $115,330 | $12,968 | $102,362 |
| 2020 | $9,423 | $109,847 | $12,968 | $96,879 |
| 2019 | $9,134 | $109,847 | $12,968 | $96,879 |
| 2018 | $920,843 | $101,291 | $14,817 | $86,474 |
| 2017 | $8,683 | $101,291 | $14,817 | $86,474 |
| 2016 | $7,912 | $92,606 | $21,660 | $70,946 |
| 2014 | $7,064 | $82,156 | $23,056 | $59,100 |
Source: Public Records
Map
Nearby Homes
- 5484 NE Northgate Crossing
- 5408 NE Wedgewood Ln
- 5468 NE Wedgewood Ln
- 5445 NE Northgate Crossing
- 5316 NE Northgate Crossing
- 5448 NE Northgate Cir
- 5720 NE Quartz Dr
- 5713 NE Sapphire Ct
- 5201 NE Sawgrass Dr
- 525 NE Olympic Ct
- 165 NE Hidden Ridge Ln
- 5103 NE Ash Grove Place
- 5416 NE Sunshine Dr
- 5608 NE Maybrook Cir
- 5912 NE Hidden Valley Dr
- 5604 NE Scenic Dr
- 5563 NW Moonlight Meadow Dr
- 5525 NW Moonlight Meadow Dr
- 5562 NW Moonlight Meadow Dr
- 4900 NE Maybrook Rd
- 5489 NE Northgate Crossing
- 5485 NE Northgate Crossing
- 5493 NE Northgate Crossing
- 5497 NE Northgate Crossing
- 5481 NE Northgate Crossing
- 5477 NE Northgate Crossing
- 5488 NE Northgate Crossing
- 5448 NE Wedgewood Ct
- 5473 NE Northgate Crossing
- 516 NE Oaks Ridge Dr
- 5444 NE Wedgewood Ct
- 520 NE Oaks Ridge Dr
- 512 NE Oaks Ridge Dr
- 508 NE Oaks Ridge Dr
- 5469 NE Northgate Crossing
- 5501 NE Northgate Crossing
- 5452 NE Wedgewood Ct
- 5521 NE Northgate Crossing
- 5440 NE Wedgewood Ct
- 5416 NE Wedgewood Ln