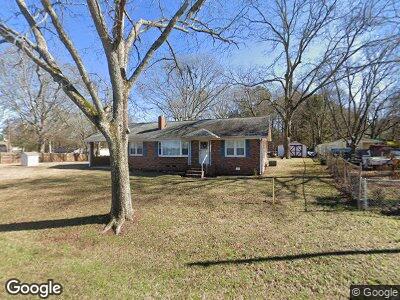
549 Highway 11 SW Monroe, GA 30655
Estimated Value: $217,901 - $319,000
--
Bed
--
Bath
1,242
Sq Ft
$209/Sq Ft
Est. Value
About This Home
This home is located at 549 Highway 11 SW, Monroe, GA 30655 and is currently estimated at $259,975, approximately $209 per square foot. 549 Highway 11 SW is a home located in Walton County with nearby schools including Harmony Elementary School, Carver Middle School, and Monroe Area High School.
Ownership History
Date
Name
Owned For
Owner Type
Purchase Details
Closed on
Jan 6, 2018
Sold by
Robertson Donald D
Bought by
Salembier Jeffery W
Current Estimated Value
Home Financials for this Owner
Home Financials are based on the most recent Mortgage that was taken out on this home.
Original Mortgage
$65,425
Outstanding Balance
$56,101
Interest Rate
3.94%
Mortgage Type
New Conventional
Estimated Equity
$194,255
Purchase Details
Closed on
Oct 27, 2006
Sold by
Fannie Mae
Bought by
Robertson Donald D
Home Financials for this Owner
Home Financials are based on the most recent Mortgage that was taken out on this home.
Original Mortgage
$61,600
Interest Rate
6.27%
Mortgage Type
New Conventional
Purchase Details
Closed on
Nov 6, 1996
Sold by
Allison Deborah
Bought by
Tillery Roger Gloria
Create a Home Valuation Report for This Property
The Home Valuation Report is an in-depth analysis detailing your home's value as well as a comparison with similar homes in the area
Home Values in the Area
Average Home Value in this Area
Purchase History
| Date | Buyer | Sale Price | Title Company |
|---|---|---|---|
| Salembier Jeffery W | -- | -- | |
| Robertson Donald D | -- | -- | |
| Tillery Roger Gloria | $57,500 | -- |
Source: Public Records
Mortgage History
| Date | Status | Borrower | Loan Amount |
|---|---|---|---|
| Open | Salembier Jeffery W | $65,425 | |
| Previous Owner | Robertson Donald D | $56,987 | |
| Previous Owner | Robertson Donald D | $61,600 | |
| Previous Owner | Tillery Roger L | $30,000 | |
| Previous Owner | Tillery Roger L | $87,000 | |
| Closed | Tillery Roger Gloria | $0 |
Source: Public Records
Tax History Compared to Growth
Tax History
| Year | Tax Paid | Tax Assessment Tax Assessment Total Assessment is a certain percentage of the fair market value that is determined by local assessors to be the total taxable value of land and additions on the property. | Land | Improvement |
|---|---|---|---|---|
| 2024 | $364 | $57,688 | $16,320 | $41,368 |
| 2023 | $169 | $50,728 | $12,560 | $38,168 |
| 2022 | $342 | $45,168 | $11,400 | $33,768 |
| 2021 | $342 | $36,848 | $6,960 | $29,888 |
| 2020 | $350 | $35,968 | $6,520 | $29,448 |
| 2019 | $356 | $33,368 | $5,000 | $28,368 |
| 2018 | $1,027 | $33,368 | $5,000 | $28,368 |
| 2017 | $1,088 | $31,568 | $4,000 | $27,568 |
| 2016 | $854 | $27,664 | $4,000 | $23,664 |
| 2015 | $830 | $26,544 | $4,000 | $22,544 |
| 2014 | $849 | $26,500 | $0 | $0 |
Source: Public Records
Map
Nearby Homes
- 0 Highway 11 Unit 10342939
- 2441 Waterside Dr
- 2429 Waterside Dr
- 1334 Criswell Rd SE
- 703 White Oak Trail
- 1283 Mount Paran Church Rd
- 709 White Oak Trail
- 1149 Criswell Rd SE
- LOT 4 Mount Paran Church Rd
- LOT 5 Mount Paran Church Rd
- 0 Criswell Rd Unit 7417062
- 1531 Overlook Pass Rd
- 376 Georgia 11
- 1169 Dean Hill Rd SE
- 376 Highway 11 SW
- 569 White Oak Way
- 2215 Mount Paran Church Rd
- 549 Highway 11 SW
- 545 Highway 11 SW
- 557 Highway 11
- 537 Highway 11 SW
- 567 Highway 11
- 567 State Highway 11
- 527 Highway 11
- 569 Highway 11 SW
- 2489 Waters Edge Dr
- 2493 Waterside Dr
- 577 Highway 11 SW
- 577 State Highway 11
- 2485 Waters Edge Dr
- 2481 Waters Edge Dr
- 5 Pleasant Valley Rd NE Unit 2453668-48299
- 5 Pleasant Valley Rd NE
- 3 Pleasant Valley Rd NE Unit 2447419-48299
- 3 Pleasant Valley Rd NE
- 512 Highway 11 SW
- 534 Highway 11