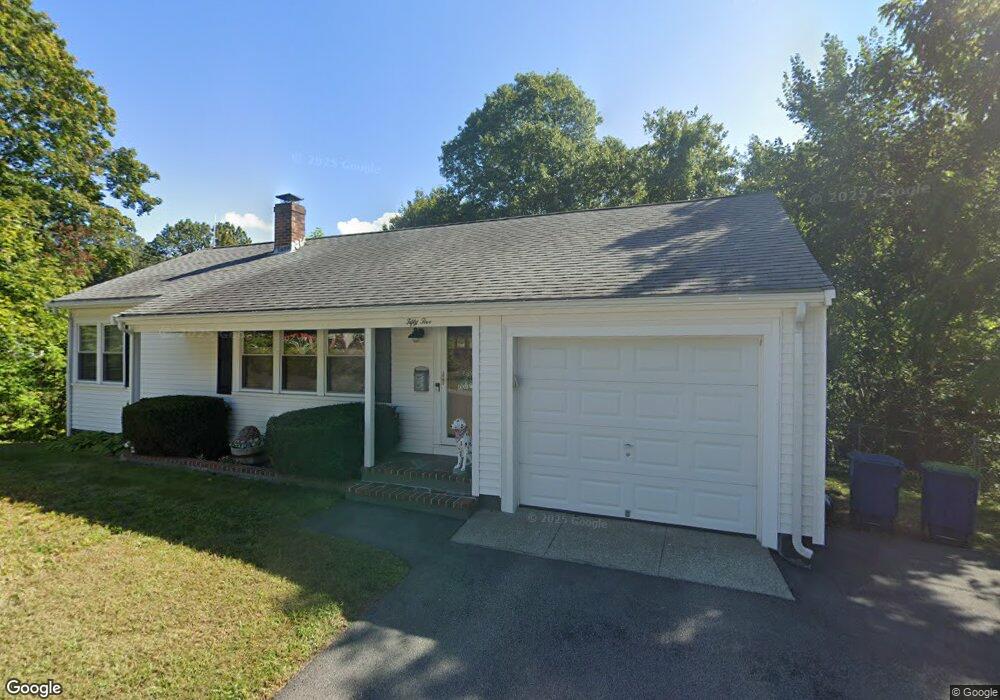
55 Alice Rd Braintree, MA 02184
North Braintree NeighborhoodEstimated Value: $481,000 - $605,403
1
Bed
2
Baths
770
Sq Ft
$684/Sq Ft
Est. Value
About This Home
This home is located at 55 Alice Rd, Braintree, MA 02184 and is currently estimated at $526,351, approximately $683 per square foot. 55 Alice Rd is a home located in Norfolk County with nearby schools including Braintree High School, Meeting House Montessori School, and Thayer Academy.
Ownership History
Date
Name
Owned For
Owner Type
Purchase Details
Closed on
Jul 17, 2017
Sold by
Sullivan Frances E
Bought by
Sullivan Frances E and Mcdonough Joan F
Current Estimated Value
Purchase Details
Closed on
Apr 30, 1996
Sold by
Welsh Kathryn S
Bought by
Sullivan Donna A
Home Financials for this Owner
Home Financials are based on the most recent Mortgage that was taken out on this home.
Original Mortgage
$97,600
Interest Rate
7.81%
Mortgage Type
Purchase Money Mortgage
Create a Home Valuation Report for This Property
The Home Valuation Report is an in-depth analysis detailing your home's value as well as a comparison with similar homes in the area
Home Values in the Area
Average Home Value in this Area
Purchase History
| Date | Buyer | Sale Price | Title Company |
|---|---|---|---|
| Sullivan Frances E | -- | -- | |
| Sullivan Donna A | $122,000 | -- | |
| Sullivan Donna A | $122,000 | -- |
Source: Public Records
Mortgage History
| Date | Status | Borrower | Loan Amount |
|---|---|---|---|
| Previous Owner | Sullivan Donna A | $97,600 |
Source: Public Records
Tax History Compared to Growth
Tax History
| Year | Tax Paid | Tax Assessment Tax Assessment Total Assessment is a certain percentage of the fair market value that is determined by local assessors to be the total taxable value of land and additions on the property. | Land | Improvement |
|---|---|---|---|---|
| 2025 | $4,969 | $497,900 | $353,000 | $144,900 |
| 2024 | $4,464 | $470,900 | $329,100 | $141,800 |
| 2023 | $4,192 | $429,500 | $295,700 | $133,800 |
| 2022 | $3,989 | $400,900 | $267,100 | $133,800 |
| 2021 | $3,793 | $381,200 | $241,400 | $139,800 |
| 2020 | $3,542 | $359,200 | $219,400 | $139,800 |
| 2019 | $3,376 | $334,600 | $209,900 | $124,700 |
| 2018 | $3,278 | $311,000 | $190,800 | $120,200 |
| 2017 | $3,238 | $301,500 | $181,300 | $120,200 |
| 2016 | $2,967 | $270,200 | $152,600 | $117,600 |
| 2015 | $2,970 | $268,300 | $150,700 | $117,600 |
| 2014 | $2,748 | $240,600 | $137,400 | $103,200 |
Source: Public Records
Map
Nearby Homes
- 305 Franklin St
- 47 Addison St
- 6 Oak St
- 78 Windemere Cir
- 7 Carter Rd
- 6 Franklin St
- 37 Monatiquot Ave
- 491 Washington St Unit 1
- 80 Lake St
- 72 Armstrong Cir
- 29 Joseph Rd
- 414 John Mahar Hwy Unit 402
- 418 John Mahar Hwy Unit 408
- 614 Pond St Unit 2104
- 614 Pond St Unit 1415
- 428 John Mahar Hwy Unit 301
- 61 Grove St
- 605 Middle St Unit 38
- 9 Independence Ave Unit 307
- 298 Lisle St