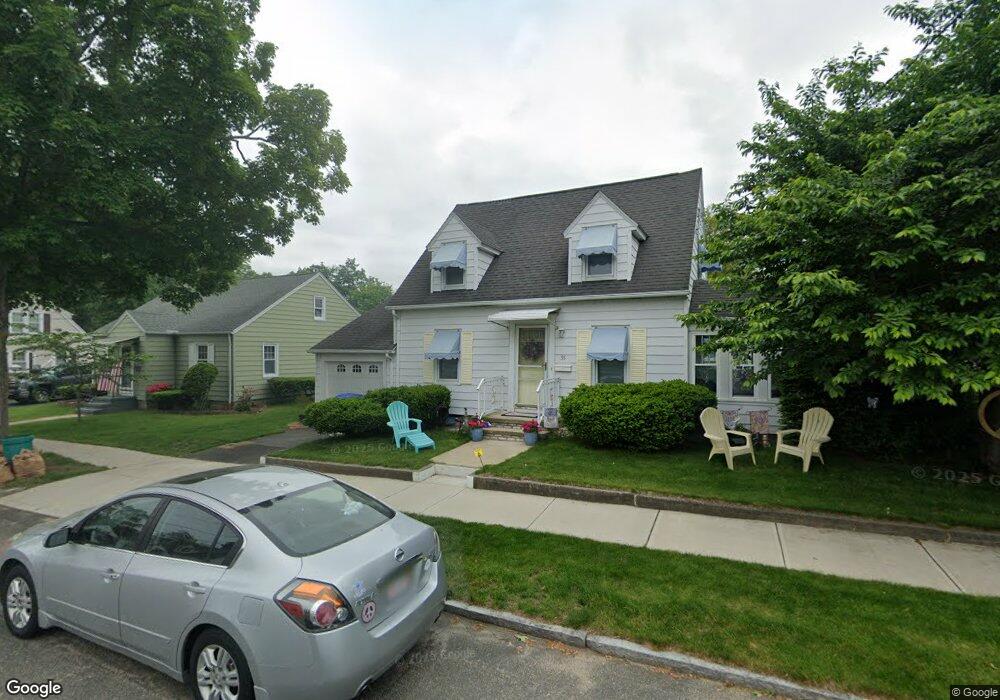
55 Ashbrook St Springfield, MA 01118
East Forest Park NeighborhoodEstimated Value: $268,000 - $327,000
2
Beds
1
Bath
1,092
Sq Ft
$271/Sq Ft
Est. Value
About This Home
This home is located at 55 Ashbrook St, Springfield, MA 01118 and is currently estimated at $296,460, approximately $271 per square foot. 55 Ashbrook St is a home located in Hampden County with nearby schools including Mary A. Dryden Veterans Memorial School, M Marcus Kiley Middle, and Springfield High School of Science and Technology.
Ownership History
Date
Name
Owned For
Owner Type
Purchase Details
Closed on
Nov 19, 2004
Sold by
Paul Brian C and Paul Michaelene G
Bought by
Paul Michaelene G
Current Estimated Value
Purchase Details
Closed on
Jul 1, 1993
Sold by
Biscotti Elizabeth R
Bought by
Paul Brian C and Paul Michaelene G
Home Financials for this Owner
Home Financials are based on the most recent Mortgage that was taken out on this home.
Original Mortgage
$86,062
Interest Rate
7.46%
Mortgage Type
Purchase Money Mortgage
Create a Home Valuation Report for This Property
The Home Valuation Report is an in-depth analysis detailing your home's value as well as a comparison with similar homes in the area
Home Values in the Area
Average Home Value in this Area
Purchase History
| Date | Buyer | Sale Price | Title Company |
|---|---|---|---|
| Paul Michaelene G | -- | -- | |
| Paul Brian C | $85,000 | -- |
Source: Public Records
Mortgage History
| Date | Status | Borrower | Loan Amount |
|---|---|---|---|
| Previous Owner | Paul Brian C | $86,062 |
Source: Public Records
Tax History
| Year | Tax Paid | Tax Assessment Tax Assessment Total Assessment is a certain percentage of the fair market value that is determined by local assessors to be the total taxable value of land and additions on the property. | Land | Improvement |
|---|---|---|---|---|
| 2025 | $4,332 | $276,300 | $47,000 | $229,300 |
| 2024 | $3,965 | $246,900 | $47,000 | $199,900 |
| 2023 | $4,097 | $240,300 | $44,800 | $195,500 |
| 2022 | $3,947 | $209,700 | $44,800 | $164,900 |
| 2021 | $3,466 | $183,400 | $40,700 | $142,700 |
| 2020 | $3,330 | $170,500 | $40,700 | $129,800 |
| 2019 | $2,340 | $169,800 | $40,700 | $129,100 |
| 2018 | $2,285 | $161,600 | $40,700 | $120,900 |
| 2017 | $2,971 | $151,100 | $40,700 | $110,400 |
| 2016 | $2,800 | $142,400 | $40,700 | $101,700 |
| 2015 | $2,862 | $145,500 | $40,700 | $104,800 |
Source: Public Records
Map
Nearby Homes
Your Personal Tour Guide
Ask me questions while you tour the home.