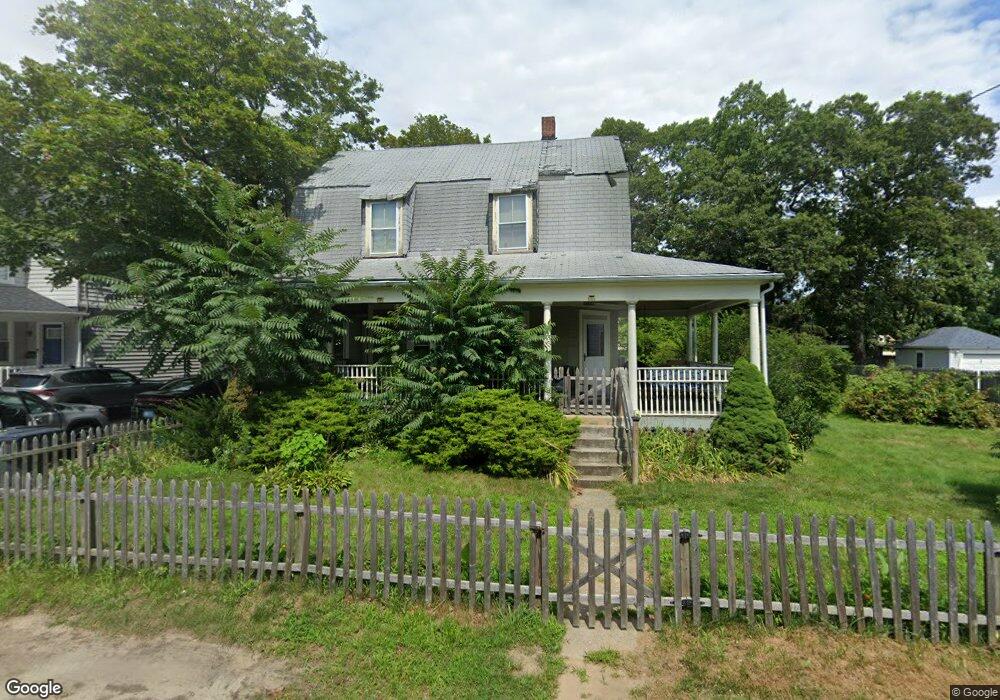
55 Blake St Warwick, RI 02889
Conimicut-Shawomet NeighborhoodEstimated Value: $376,611 - $409,000
3
Beds
1
Bath
1,336
Sq Ft
$296/Sq Ft
Est. Value
About This Home
This home is located at 55 Blake St, Warwick, RI 02889 and is currently estimated at $395,653, approximately $296 per square foot. 55 Blake St is a home located in Kent County with nearby schools including Saint Kevin School and Bishop Hendricken High School.
Ownership History
Date
Name
Owned For
Owner Type
Purchase Details
Closed on
Aug 10, 2007
Sold by
Spencer Peter E and Spencer Amy L
Bought by
Duguay Paul J and Duguay Candace L
Current Estimated Value
Home Financials for this Owner
Home Financials are based on the most recent Mortgage that was taken out on this home.
Original Mortgage
$225,000
Outstanding Balance
$140,254
Interest Rate
6.72%
Mortgage Type
Purchase Money Mortgage
Estimated Equity
$255,399
Purchase Details
Closed on
Jul 17, 2000
Sold by
Mccann B Tracy
Bought by
Spencer Peter E and Laroche Amy L
Create a Home Valuation Report for This Property
The Home Valuation Report is an in-depth analysis detailing your home's value as well as a comparison with similar homes in the area
Home Values in the Area
Average Home Value in this Area
Purchase History
| Date | Buyer | Sale Price | Title Company |
|---|---|---|---|
| Duguay Paul J | $225,000 | -- | |
| Spencer Peter E | $107,000 | -- |
Source: Public Records
Mortgage History
| Date | Status | Borrower | Loan Amount |
|---|---|---|---|
| Open | Spencer Peter E | $225,000 | |
| Previous Owner | Spencer Peter E | $135,000 | |
| Previous Owner | Spencer Peter E | $104,547 | |
| Previous Owner | Spencer Peter E | $15,000 |
Source: Public Records
Tax History
| Year | Tax Paid | Tax Assessment Tax Assessment Total Assessment is a certain percentage of the fair market value that is determined by local assessors to be the total taxable value of land and additions on the property. | Land | Improvement |
|---|---|---|---|---|
| 2025 | $3,962 | $312,000 | $105,800 | $206,200 |
| 2024 | $3,762 | $260,000 | $87,400 | $172,600 |
| 2023 | $3,689 | $260,000 | $87,400 | $172,600 |
| 2022 | $3,347 | $178,700 | $52,800 | $125,900 |
| 2021 | $3,347 | $178,700 | $52,800 | $125,900 |
| 2020 | $3,347 | $178,700 | $52,800 | $125,900 |
| 2019 | $3,347 | $178,700 | $52,800 | $125,900 |
| 2018 | $2,729 | $131,200 | $52,800 | $78,400 |
| 2017 | $2,655 | $131,200 | $52,800 | $78,400 |
| 2016 | $2,655 | $131,200 | $52,800 | $78,400 |
| 2015 | $2,805 | $135,200 | $66,500 | $68,700 |
| 2014 | $2,712 | $135,200 | $66,500 | $68,700 |
| 2013 | $2,676 | $135,200 | $66,500 | $68,700 |
Source: Public Records
Map
Nearby Homes
Your Personal Tour Guide
Ask me questions while you tour the home.