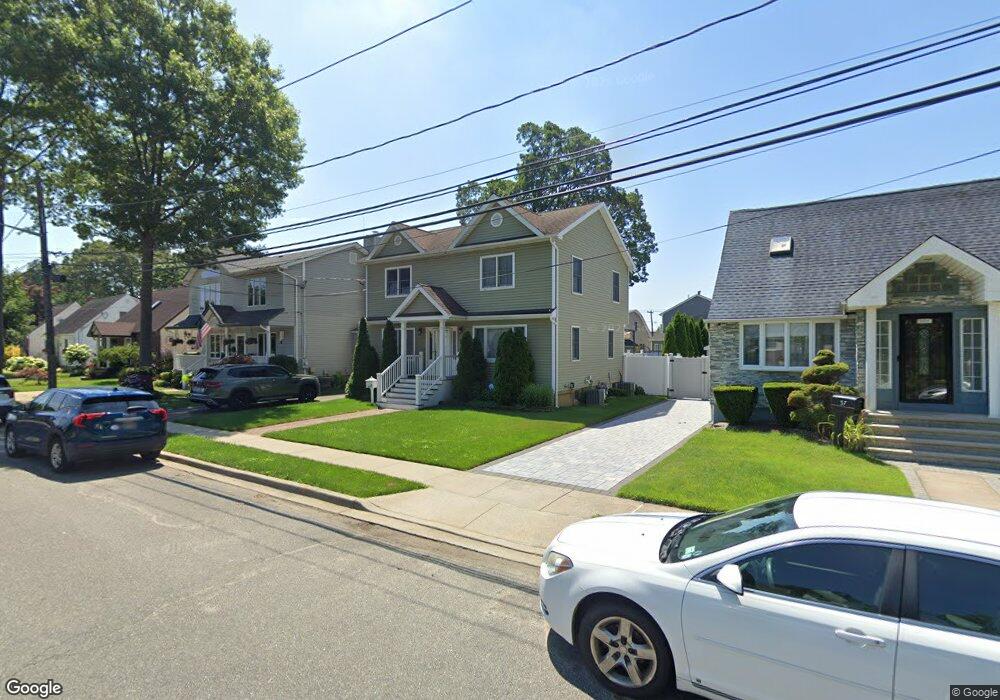
55 Croydon Dr Bellmore, NY 11710
Estimated Value: $780,000 - $804,575
--
Bed
2
Baths
1,664
Sq Ft
$476/Sq Ft
Est. Value
About This Home
This home is located at 55 Croydon Dr, Bellmore, NY 11710 and is currently estimated at $792,288, approximately $476 per square foot. 55 Croydon Dr is a home located in Nassau County with nearby schools including Grand Avenue Middle School, Wellington C Mepham High School, and St. Elizabeth Ann Seton Regional School.
Ownership History
Date
Name
Owned For
Owner Type
Purchase Details
Closed on
Jun 19, 2024
Sold by
Laino Kevin and Javal Katrina
Bought by
Laino Kevin and Laino Anna Katrina
Current Estimated Value
Home Financials for this Owner
Home Financials are based on the most recent Mortgage that was taken out on this home.
Original Mortgage
$630,850
Outstanding Balance
$622,799
Interest Rate
7.02%
Mortgage Type
FHA
Estimated Equity
$169,489
Purchase Details
Closed on
Dec 22, 2011
Sold by
Dudley Tony
Bought by
Laino Kevin and Javal Katrina
Home Financials for this Owner
Home Financials are based on the most recent Mortgage that was taken out on this home.
Original Mortgage
$451,749
Interest Rate
3.87%
Mortgage Type
FHA
Purchase Details
Closed on
Mar 20, 1996
Sold by
Kelly George and Kelly Carol
Bought by
Dudley Tony and Dudley Kerry
Home Financials for this Owner
Home Financials are based on the most recent Mortgage that was taken out on this home.
Original Mortgage
$149,150
Interest Rate
6.9%
Create a Home Valuation Report for This Property
The Home Valuation Report is an in-depth analysis detailing your home's value as well as a comparison with similar homes in the area
Home Values in the Area
Average Home Value in this Area
Purchase History
| Date | Buyer | Sale Price | Title Company |
|---|---|---|---|
| Laino Kevin | -- | Wfg National Title Ins Co | |
| Laino Kevin | -- | Wfg National Title Ins Co | |
| Laino Kevin | $463,500 | -- | |
| Laino Kevin | $463,500 | -- | |
| Laino Kevin | $463,500 | -- | |
| Dudley Tony | $157,000 | -- | |
| Dudley Tony | $157,000 | -- |
Source: Public Records
Mortgage History
| Date | Status | Borrower | Loan Amount |
|---|---|---|---|
| Open | Laino Kevin | $630,850 | |
| Closed | Laino Kevin | $630,850 | |
| Closed | Laino Kevin | $451,749 | |
| Previous Owner | Dudley Tony | $149,150 |
Source: Public Records
Tax History Compared to Growth
Tax History
| Year | Tax Paid | Tax Assessment Tax Assessment Total Assessment is a certain percentage of the fair market value that is determined by local assessors to be the total taxable value of land and additions on the property. | Land | Improvement |
|---|---|---|---|---|
| 2025 | $13,502 | $505 | $155 | $350 |
| 2024 | $3,688 | $516 | $158 | $358 |
| 2023 | $11,839 | $541 | $166 | $375 |
| 2022 | $11,839 | $541 | $166 | $375 |
| 2021 | $14,838 | $564 | $167 | $397 |
| 2020 | $11,591 | $689 | $517 | $172 |
| 2019 | $11,165 | $738 | $520 | $218 |
| 2018 | $11,276 | $787 | $0 | $0 |
| 2017 | $7,725 | $836 | $445 | $391 |
| 2016 | $11,387 | $1,040 | $554 | $486 |
| 2015 | $4,242 | $1,040 | $554 | $486 |
| 2014 | $4,242 | $1,040 | $554 | $486 |
| 2013 | $3,982 | $1,040 | $554 | $486 |
Source: Public Records
Map
Nearby Homes
- 2434 Martin Ave
- 1776 Roberta Ln
- 208 Camp Ave
- 10 Airway Dr
- 70 Nancy Blvd
- 2288 Locust St
- 5 Oak Brook Ln
- 204 Howell St
- 205 Howell St
- 2282 Sycamore Place
- 335 Smith St
- 239 Stephen St
- 1585 Dewey Ave
- 123 Mitchell St
- 2468 Lincoln Blvd
- 2239 Henry St
- 105 Howell St
- 2355 Mitchell Place
- 13 Metropolitan Ave
- 2522 Lincoln Blvd