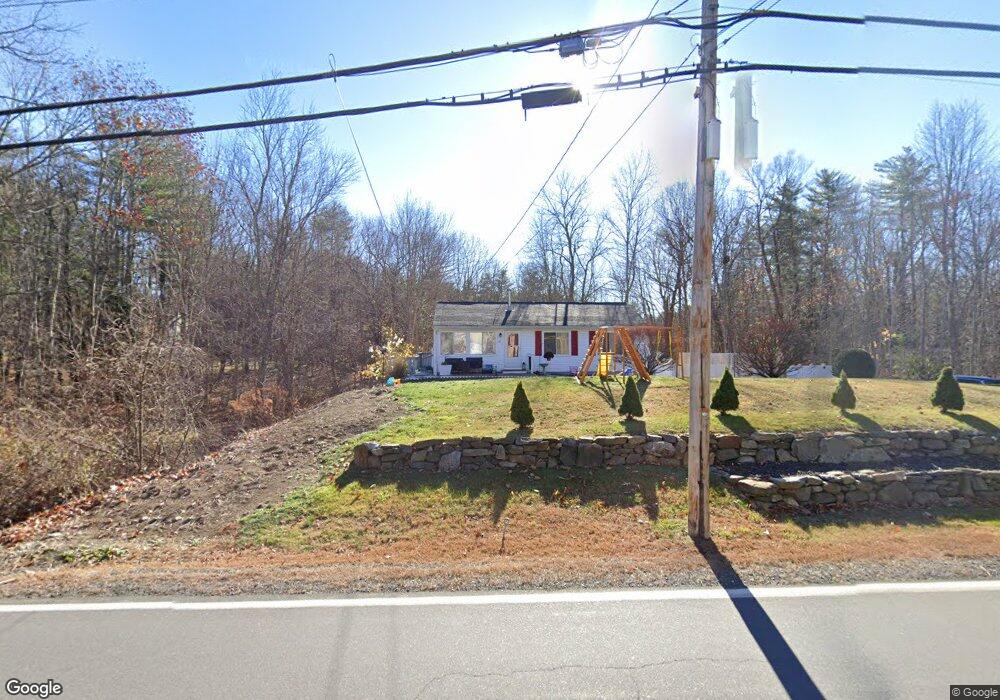
55 Piscassic Rd Newfields, NH 03856
Estimated Value: $1,074,000 - $1,482,000
4
Beds
4
Baths
4,480
Sq Ft
$282/Sq Ft
Est. Value
About This Home
This home is located at 55 Piscassic Rd, Newfields, NH 03856 and is currently estimated at $1,261,973, approximately $281 per square foot. 55 Piscassic Rd is a home with nearby schools including Newfields Elementary School, Cooperative Middle School, and Exeter High School.
Ownership History
Date
Name
Owned For
Owner Type
Purchase Details
Closed on
Mar 26, 2021
Sold by
Thomas H Conner Ret
Bought by
2011 Goulet Ft
Current Estimated Value
Purchase Details
Closed on
Mar 14, 2016
Sold by
Goulet Kevin J
Bought by
Newbrook Properties Ll
Create a Home Valuation Report for This Property
The Home Valuation Report is an in-depth analysis detailing your home's value as well as a comparison with similar homes in the area
Home Values in the Area
Average Home Value in this Area
Purchase History
| Date | Buyer | Sale Price | Title Company |
|---|---|---|---|
| 2011 Goulet Ft | $155,000 | None Available | |
| Newbrook Properties Ll | -- | -- |
Source: Public Records
Tax History
| Year | Tax Paid | Tax Assessment Tax Assessment Total Assessment is a certain percentage of the fair market value that is determined by local assessors to be the total taxable value of land and additions on the property. | Land | Improvement |
|---|---|---|---|---|
| 2025 | $16,343 | $964,165 | $249,665 | $714,500 |
| 2024 | $15,514 | $964,196 | $249,696 | $714,500 |
| 2023 | $15,225 | $964,190 | $249,690 | $714,500 |
| 2022 | $13,995 | $667,712 | $184,712 | $483,000 |
| 2021 | $13,697 | $666,539 | $184,939 | $481,600 |
| 2020 | $14,622 | $688,400 | $213,500 | $474,900 |
| 2019 | $14,174 | $688,400 | $213,500 | $474,900 |
| 2018 | $13,665 | $688,400 | $213,500 | $474,900 |
| 2017 | $14,163 | $591,600 | $196,900 | $394,700 |
| 2016 | $13,737 | $591,600 | $196,900 | $394,700 |
| 2015 | $12,383 | $537,700 | $196,900 | $340,800 |
| 2014 | $13,039 | $537,700 | $196,900 | $340,800 |
| 2013 | $12,276 | $505,600 | $196,900 | $308,700 |
Source: Public Records
Map
Nearby Homes
- 120 Exeter Rd
- 104 Piscassic Rd
- 3 Swamscott St
- 28 Partridge Hill Rd
- 00 Piscassic & Oaklands Rd Unit 1
- 19 Halls Mill Rd
- 10 Wingate Ct
- 85 College Rd
- 5 Ridge Rd
- 12 Runaway Rd
- 9 Captain's Way
- 0 Autumn Ln
- 74 College Rd
- 56 Peninsula Dr
- 63 Peninsula Dr
- 60 Peninsula Dr
- 221 Piscassic Rd
- 20 Madison Ln
- 1 Firefly Landing
- 8 Stonewall Way
- 47 Piscassic Rd
- 51 Piscassic Rd
- 59 Piscassic Rd
- 45 Piscassic Rd
- 35 Piscassic Rd
- 65 Piscassic Rd
- 41 Piscassic Rd
- 56 Piscassic Rd
- 52 Piscassic Rd
- 37 Piscassic Rd
- 44 Piscassic Rd
- 2 Heath Dr
- 33 Piscassic Rd
- 5 Dixon Ave
- Lot S Heath Dr Unit S
- 4 Dixon Ave
- 31 Piscassic Rd
- 42 Piscassic Rd
- 29 Piscassic Rd
- Lot Q Heath
Your Personal Tour Guide
Ask me questions while you tour the home.