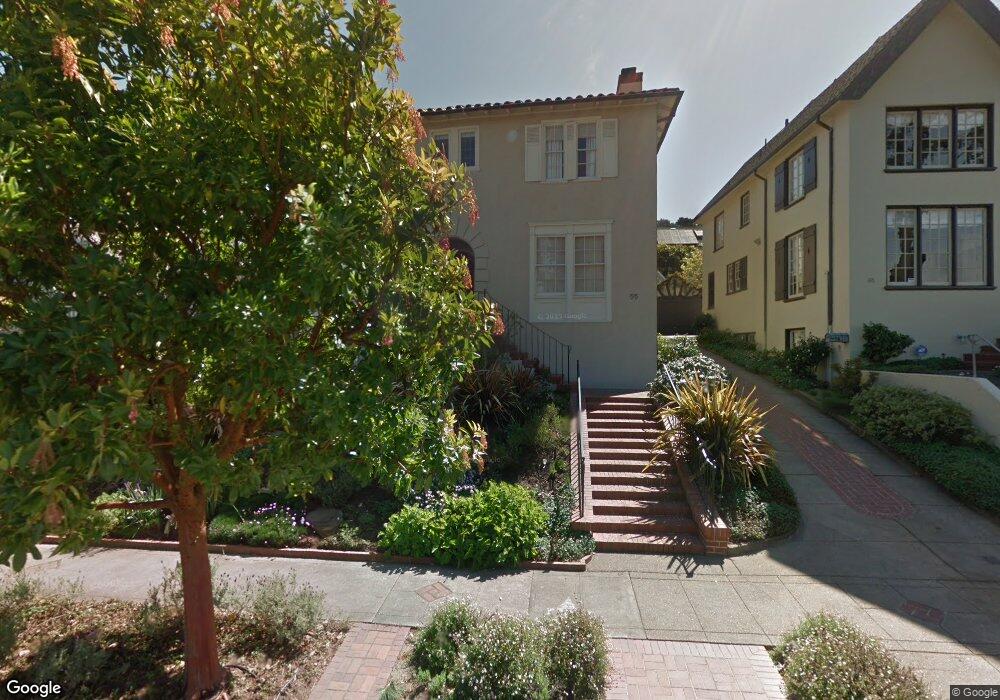
55 San Lorenzo Way San Francisco, CA 94127
Saint Francis Wood NeighborhoodEstimated Value: $3,298,724 - $4,112,000
4
Beds
3
Baths
3,529
Sq Ft
$1,019/Sq Ft
Est. Value
About This Home
This home is located at 55 San Lorenzo Way, San Francisco, CA 94127 and is currently estimated at $3,596,431, approximately $1,019 per square foot. 55 San Lorenzo Way is a home located in San Francisco County with nearby schools including Miraloma Elementary School, Denman (James) Middle School, and St. Cecilia School.
Ownership History
Date
Name
Owned For
Owner Type
Purchase Details
Closed on
Jul 14, 2017
Sold by
Wang Wei and Dong Jinli
Bought by
Wang Wei and Dong Jinli
Current Estimated Value
Home Financials for this Owner
Home Financials are based on the most recent Mortgage that was taken out on this home.
Original Mortgage
$2,000,000
Outstanding Balance
$1,688,782
Interest Rate
4.5%
Mortgage Type
Purchase Money Mortgage
Estimated Equity
$1,907,649
Purchase Details
Closed on
May 21, 2010
Sold by
Torresi Cristiano and Torresi Pilar
Bought by
Wang Wei and Dong Jinli
Home Financials for this Owner
Home Financials are based on the most recent Mortgage that was taken out on this home.
Original Mortgage
$1,560,000
Interest Rate
5.03%
Mortgage Type
New Conventional
Purchase Details
Closed on
Mar 11, 2001
Sold by
Green Tracey C and Coss Peter B
Bought by
Torresi Cristiano and Torresi Pilar
Create a Home Valuation Report for This Property
The Home Valuation Report is an in-depth analysis detailing your home's value as well as a comparison with similar homes in the area
Home Values in the Area
Average Home Value in this Area
Purchase History
| Date | Buyer | Sale Price | Title Company |
|---|---|---|---|
| Wang Wei | -- | None Available | |
| Wang Wei | $1,950,000 | Old Republic Title Company | |
| Torresi Cristiano | -- | First American Title Co | |
| Green Tracey C | -- | First American Title Co |
Source: Public Records
Mortgage History
| Date | Status | Borrower | Loan Amount |
|---|---|---|---|
| Open | Wang Wei | $2,000,000 | |
| Closed | Wang Wei | $1,560,000 |
Source: Public Records
Tax History Compared to Growth
Tax History
| Year | Tax Paid | Tax Assessment Tax Assessment Total Assessment is a certain percentage of the fair market value that is determined by local assessors to be the total taxable value of land and additions on the property. | Land | Improvement |
|---|---|---|---|---|
| 2025 | $29,615 | $2,517,095 | $1,761,969 | $755,126 |
| 2024 | $29,615 | $2,467,741 | $1,727,421 | $740,320 |
| 2023 | $29,176 | $2,419,354 | $1,693,550 | $725,804 |
| 2022 | $28,632 | $2,371,917 | $1,660,344 | $711,573 |
| 2021 | $28,129 | $2,325,410 | $1,627,789 | $697,621 |
| 2020 | $28,240 | $2,301,567 | $1,611,099 | $690,468 |
| 2019 | $27,266 | $2,256,439 | $1,579,509 | $676,930 |
| 2018 | $26,345 | $2,212,196 | $1,548,539 | $663,657 |
| 2017 | $25,735 | $2,168,821 | $1,518,176 | $650,645 |
| 2016 | $25,343 | $2,126,296 | $1,488,408 | $637,888 |
| 2015 | $25,030 | $2,094,358 | $1,466,051 | $628,307 |
| 2014 | $24,368 | $2,053,334 | $1,437,334 | $616,000 |
Source: Public Records
Map
Nearby Homes
- 92 San Pablo Ave
- 8 San Lorenzo Way
- 130 San Pablo Ave
- 44 Yerba Buena Ave
- 270 Claremont Blvd
- 160 Wawona St
- 111 Edgehill Way
- 325 Wawona St
- 129 Edgehill Way
- 154 Maywood Dr
- 285 Edgehill Way
- 72 Cresta Vista Dr
- 327 Ulloa St
- 75 San Jacinto Way
- 1475 Monterey Blvd
- 45 Dalewood Way
- 95 Junipero Serra Blvd
- 245 Westgate Dr
- 2266 9th Ave
- 634-636 Taraval St
- 45 San Lorenzo Way
- 65 San Lorenzo Way
- 35 San Lorenzo Way
- 56 Santa Paula Ave
- 50 Santa Paula Ave
- 75 San Lorenzo Way
- 66 Santa Paula Ave
- 10 San Lorenzo Way
- 42 Santa Paula Ave
- 70 Santa Paula Ave
- 15 San Lorenzo Way
- 75 Santa Monica Way
- 40 Santa Paula Ave
- 55 Santa Monica Way
- 45 Santa Monica Way
- 20 San Lorenzo Way
- 30 Santa Paula Ave
- 80 Santa Paula Ave
- 85 Santa Monica Way
- 41 Santa Monica Way