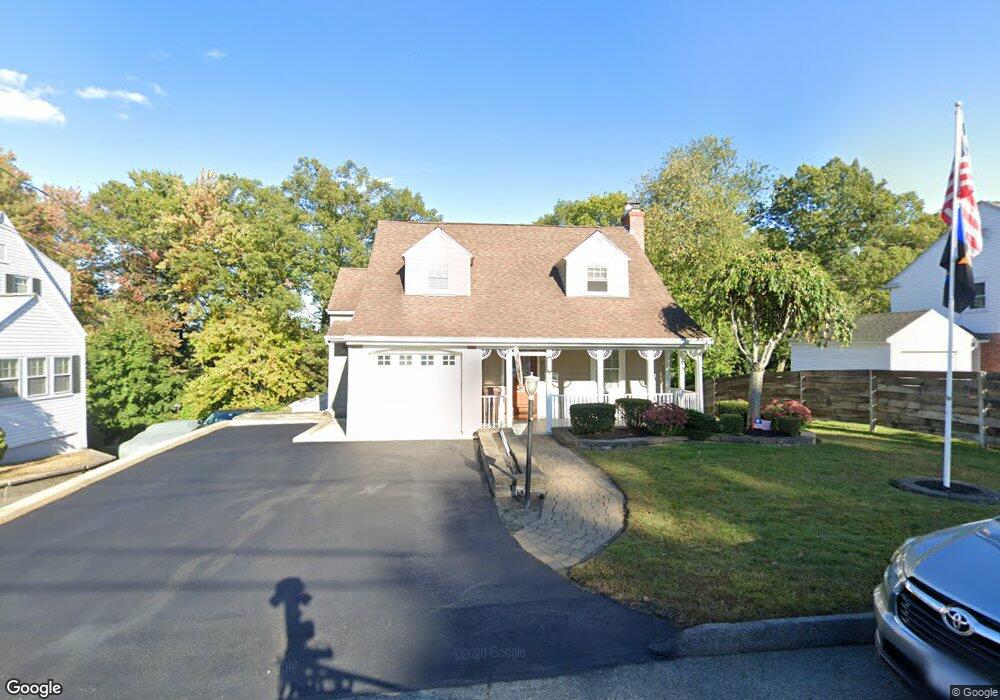
55 Sumner St Auburn, MA 01501
Stoneville NeighborhoodEstimated Value: $509,652 - $571,000
3
Beds
3
Baths
1,831
Sq Ft
$292/Sq Ft
Est. Value
About This Home
This home is located at 55 Sumner St, Auburn, MA 01501 and is currently estimated at $534,163, approximately $291 per square foot. 55 Sumner St is a home located in Worcester County with nearby schools including Auburn Senior High School, Canterbury Street School, and Shrewsbury Montessori School - Auburn Campus.
Ownership History
Date
Name
Owned For
Owner Type
Purchase Details
Closed on
Dec 16, 1983
Bought by
Oconnor Richard W
Current Estimated Value
Create a Home Valuation Report for This Property
The Home Valuation Report is an in-depth analysis detailing your home's value as well as a comparison with similar homes in the area
Home Values in the Area
Average Home Value in this Area
Purchase History
| Date | Buyer | Sale Price | Title Company |
|---|---|---|---|
| Oconnor Richard W | -- | -- |
Source: Public Records
Mortgage History
| Date | Status | Borrower | Loan Amount |
|---|---|---|---|
| Open | Oconnor Richard W | $25,000 | |
| Closed | Oconnor Richard W | $43,600 | |
| Closed | Oconnor Richard W | $50,000 |
Source: Public Records
Tax History
| Year | Tax Paid | Tax Assessment Tax Assessment Total Assessment is a certain percentage of the fair market value that is determined by local assessors to be the total taxable value of land and additions on the property. | Land | Improvement |
|---|---|---|---|---|
| 2025 | $7,278 | $509,300 | $114,700 | $394,600 |
| 2024 | $6,750 | $452,100 | $109,200 | $342,900 |
| 2023 | $6,655 | $419,100 | $99,300 | $319,800 |
| 2022 | $6,114 | $363,500 | $99,300 | $264,200 |
| 2021 | $5,796 | $319,500 | $87,600 | $231,900 |
| 2020 | $5,581 | $310,400 | $87,600 | $222,800 |
| 2019 | $5,187 | $281,600 | $86,700 | $194,900 |
| 2018 | $5,008 | $271,600 | $81,100 | $190,500 |
| 2017 | $4,673 | $254,800 | $73,500 | $181,300 |
| 2016 | $4,423 | $244,500 | $77,100 | $167,400 |
| 2015 | $4,042 | $234,200 | $77,100 | $157,100 |
| 2014 | $3,956 | $228,800 | $73,400 | $155,400 |
Source: Public Records
Map
Nearby Homes
- 5 Commonwealth Ave
- 99 Clover St
- 177 Boyce St
- 25 Vinal St Unit 28
- 25 Vinal St Unit 26
- 25 Vinal St Unit 29
- 25 Vinal St Unit 30
- 1 Rockland Road Ct
- 177 Oxford St N
- 204-212 Hampton St
- 11 Hulbert Rd Unit 13
- 1034 Southbridge St
- 31-33 Walsh Ave
- 33 Walsh Ave
- 31 Walsh Ave
- 154 Pakachoag St
- 40 Bryn Mawr Ave
- 19-20 Williams St
- 27 Havana Rd
- 103 Henshaw St
Your Personal Tour Guide
Ask me questions while you tour the home.