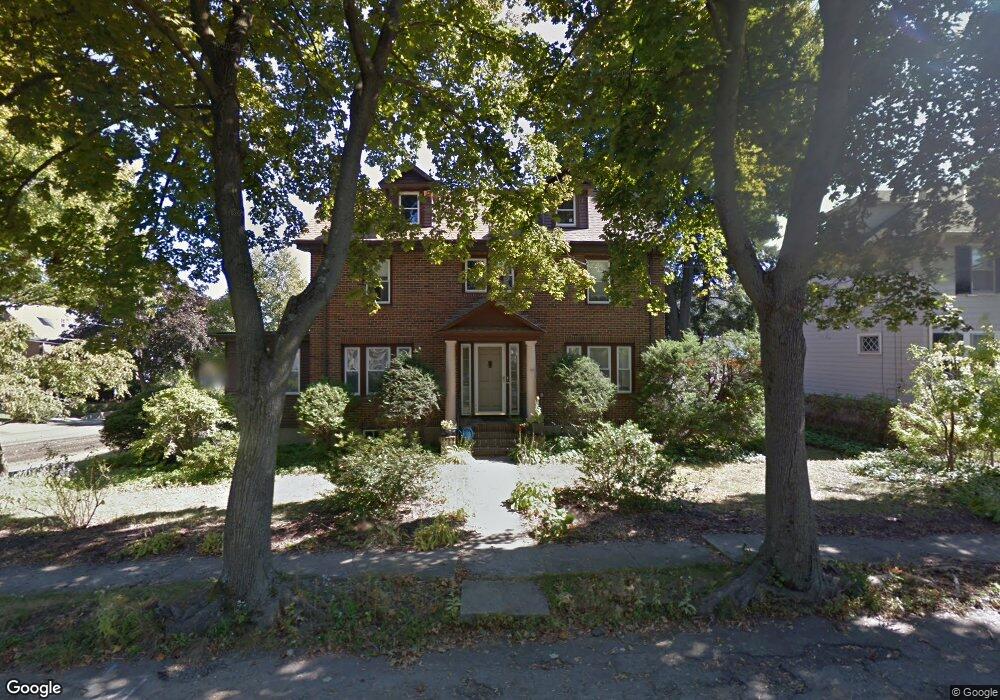
55 Van Ness Rd Belmont, MA 02478
Cushing Square NeighborhoodEstimated Value: $1,524,000 - $1,787,000
3
Beds
2
Baths
1,880
Sq Ft
$859/Sq Ft
Est. Value
About This Home
This home is located at 55 Van Ness Rd, Belmont, MA 02478 and is currently estimated at $1,615,575, approximately $859 per square foot. 55 Van Ness Rd is a home located in Middlesex County with nearby schools including Roger Wellington Elementary School, Winthrop L Chenery Middle School, and Belmont High School.
Ownership History
Date
Name
Owned For
Owner Type
Purchase Details
Closed on
Aug 30, 2002
Sold by
Hilhal Nt and Sahyoun Walid
Bought by
Quirk Anne E and Carey Robert M
Current Estimated Value
Home Financials for this Owner
Home Financials are based on the most recent Mortgage that was taken out on this home.
Original Mortgage
$410,000
Outstanding Balance
$175,140
Interest Rate
6.55%
Mortgage Type
Purchase Money Mortgage
Estimated Equity
$1,440,435
Create a Home Valuation Report for This Property
The Home Valuation Report is an in-depth analysis detailing your home's value as well as a comparison with similar homes in the area
Home Values in the Area
Average Home Value in this Area
Purchase History
| Date | Buyer | Sale Price | Title Company |
|---|---|---|---|
| Quirk Anne E | $680,000 | -- |
Source: Public Records
Mortgage History
| Date | Status | Borrower | Loan Amount |
|---|---|---|---|
| Open | Quirk Anne E | $410,000 |
Source: Public Records
Tax History Compared to Growth
Tax History
| Year | Tax Paid | Tax Assessment Tax Assessment Total Assessment is a certain percentage of the fair market value that is determined by local assessors to be the total taxable value of land and additions on the property. | Land | Improvement |
|---|---|---|---|---|
| 2025 | $17,768 | $1,560,000 | $810,000 | $750,000 |
| 2024 | $16,294 | $1,543,000 | $959,000 | $584,000 |
| 2023 | $16,141 | $1,436,000 | $905,000 | $531,000 |
| 2022 | $16,687 | $1,324,000 | $828,000 | $496,000 |
| 2021 | $10,796 | $1,446,000 | $1,035,000 | $411,000 |
| 2020 | $14,256 | $1,296,000 | $885,000 | $411,000 |
| 2019 | $13,486 | $1,047,000 | $670,000 | $377,000 |
| 2018 | $10,071 | $986,000 | $609,000 | $377,000 |
| 2017 | $9,729 | $912,000 | $535,000 | $377,000 |
| 2016 | $11,417 | $909,000 | $535,000 | $374,000 |
| 2015 | $10,746 | $833,000 | $460,000 | $373,000 |
Source: Public Records
Map
Nearby Homes
- 276 Belmont St Unit 1
- 147 Langdon Ave Unit 149
- 73 Foster Rd Unit 2
- 133 Hillside Rd
- 81 Winsor Ave
- 456 Belmont St Unit 10
- 456 Belmont St Unit 21
- 56-58 Edgecliff Rd
- 30 Unity Ave Unit 30
- 87 Templeton Pkwy Unit 3
- 10 Marlboro St Unit 1
- 163 Belmont St
- 125 Trapelo Rd Unit 21
- 125 Trapelo Rd Unit 23
- 36 Madison St
- 43 Irma Ave Unit 43
- 1 Clayton St
- 16 Ericsson St
- 105 Watson Rd
- 161 Cushing St