Estimated Value: $500,292 - $600,000
3
Beds
3
Baths
2,000
Sq Ft
$265/Sq Ft
Est. Value
About This Home
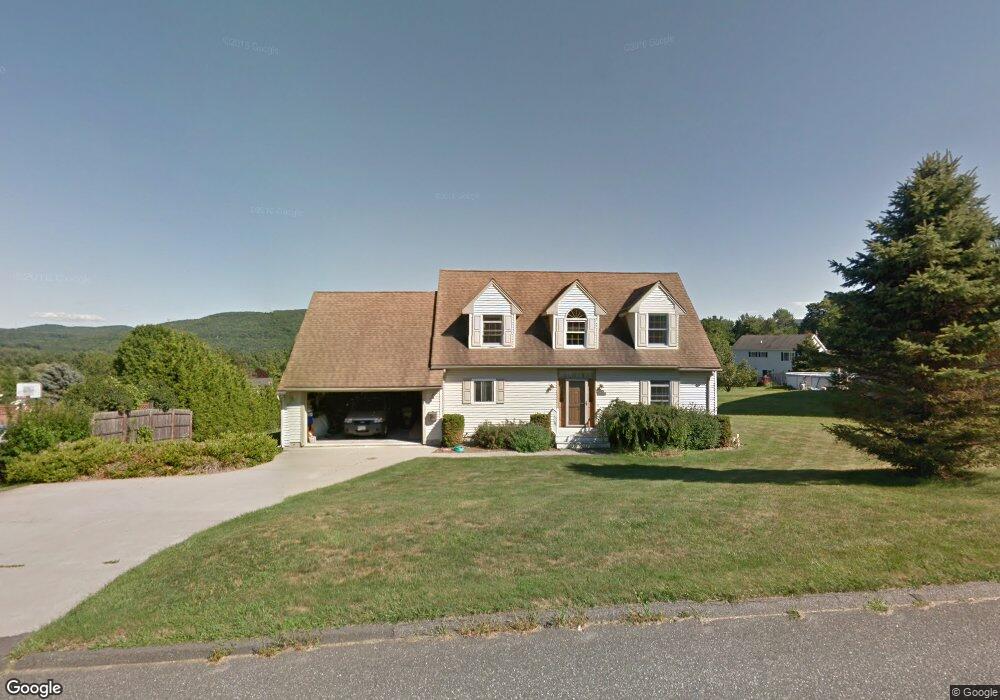
This home is located at 55 Via Bondi, Lee, MA 01238 and is currently estimated at $530,073, approximately $265 per square foot. 55 Via Bondi is a home located in Berkshire County with nearby schools including Lee Elementary School, Lee Middle/High School, and St. Mary's School.
Ownership History
Date
Name
Owned For
Owner Type
Purchase Details
Closed on
Jul 27, 2020
Sold by
Bockmann Robert W
Bought by
Robert W Bockmann Ret
Current Estimated Value
Purchase Details
Closed on
May 29, 2009
Sold by
Bockmann Robert W and Bockmann Rosealie E F
Bought by
Bockmann Robert W
Purchase Details
Closed on
Jul 17, 2000
Sold by
Kiwanis Club Of Lee
Bought by
Bockmann Robert W and Bockmann Rosalie Ef
Home Financials for this Owner
Home Financials are based on the most recent Mortgage that was taken out on this home.
Original Mortgage
$105,000
Interest Rate
8.5%
Mortgage Type
Purchase Money Mortgage
Purchase Details
Closed on
Sep 3, 1999
Sold by
Consolati Frank P and Consolati Mary S
Bought by
Kiwanis Clb
Home Financials for this Owner
Home Financials are based on the most recent Mortgage that was taken out on this home.
Original Mortgage
$131,250
Interest Rate
7.5%
Mortgage Type
Purchase Money Mortgage
Create a Home Valuation Report for This Property
The Home Valuation Report is an in-depth analysis detailing your home's value as well as a comparison with similar homes in the area
Home Values in the Area
Average Home Value in this Area
Purchase History
| Date | Buyer | Sale Price | Title Company |
|---|---|---|---|
| Robert W Bockmann Ret | -- | None Available | |
| Bockmann Robert W | -- | -- | |
| Bockmann Robert W | $220,000 | -- | |
| Kiwanis Clb | $53,000 | -- |
Source: Public Records
Mortgage History
| Date | Status | Borrower | Loan Amount |
|---|---|---|---|
| Previous Owner | Kiwanis Clb | $101,000 | |
| Previous Owner | Kiwanis Clb | $75,000 | |
| Previous Owner | Kiwanis Clb | $105,000 | |
| Previous Owner | Kiwanis Clb | $131,250 |
Source: Public Records
Tax History
| Year | Tax Paid | Tax Assessment Tax Assessment Total Assessment is a certain percentage of the fair market value that is determined by local assessors to be the total taxable value of land and additions on the property. | Land | Improvement |
|---|---|---|---|---|
| 2025 | $5,007 | $445,100 | $138,000 | $307,100 |
| 2024 | $4,557 | $405,400 | $142,200 | $263,200 |
| 2023 | $4,286 | $362,300 | $136,300 | $226,000 |
| 2022 | $4,805 | $352,000 | $129,700 | $222,300 |
| 2021 | $4,328 | $294,800 | $111,000 | $183,800 |
| 2020 | $4,210 | $286,800 | $110,900 | $175,900 |
| 2019 | $4,292 | $290,400 | $110,900 | $179,500 |
| 2018 | $4,278 | $292,400 | $112,900 | $179,500 |
| 2017 | $4,432 | $301,100 | $112,900 | $188,200 |
| 2016 | $4,384 | $301,100 | $112,900 | $188,200 |
| 2015 | $4,239 | $301,100 | $112,900 | $188,200 |
| 2014 | $4,128 | $291,700 | $108,800 | $182,900 |
Source: Public Records
Map
Nearby Homes
- 2 Devon Rd
- 560 Stockbridge Rd
- 1020 Fairview St
- 62 Stockbridge Terrace
- 82 Stockbridge Terrace
- 160 High St
- 1600 Pleasant St
- 205 High St
- 190 Willow St
- 131 Center St
- 180 Center St
- 2 Wallace Rd Unit DH-B
- 155 Laurel St
- 30 Pease Terrace
- 17 East St
- 140 Theresa Terrace
- 45 Forest St
- 135 East St
- 8 Yale Hill Rd
- 86 E Main St
Your Personal Tour Guide
Ask me questions while you tour the home.