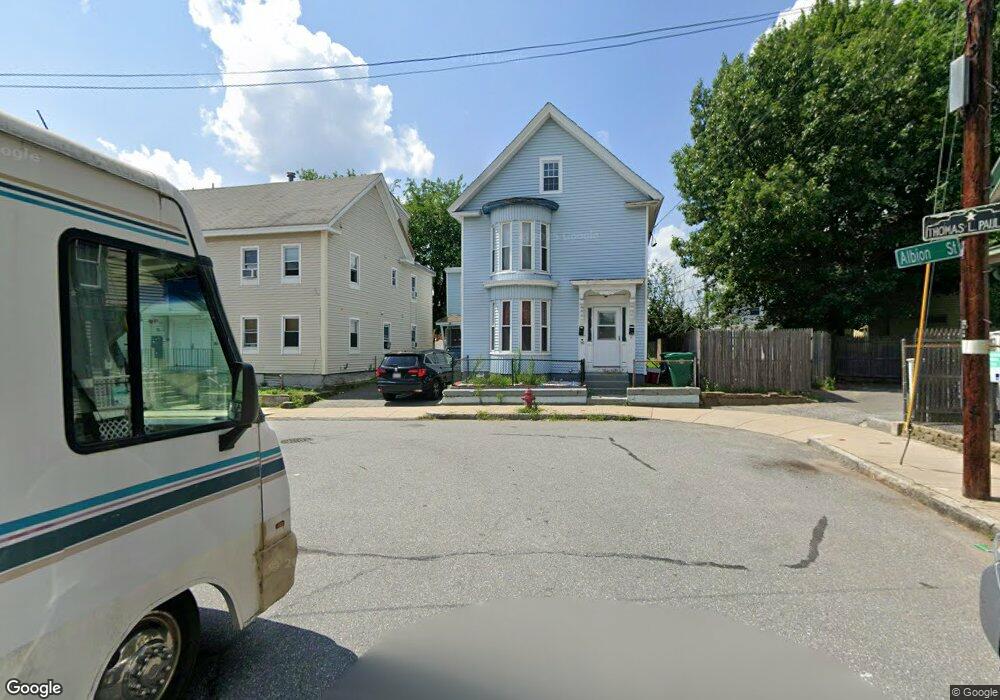
55 W 5th St Lowell, MA 01850
Centralville NeighborhoodEstimated Value: $446,903 - $500,000
4
Beds
2
Baths
1,365
Sq Ft
$351/Sq Ft
Est. Value
About This Home
This home is located at 55 W 5th St, Lowell, MA 01850 and is currently estimated at $478,976, approximately $350 per square foot. 55 W 5th St is a home with nearby schools including Greenhalge Elementary School, S. Christa McAuliffe Elementary School, and Moody Elementary School.
Ownership History
Date
Name
Owned For
Owner Type
Purchase Details
Closed on
Jun 2, 2020
Sold by
Desmond Donna
Bought by
Yan Marady
Current Estimated Value
Home Financials for this Owner
Home Financials are based on the most recent Mortgage that was taken out on this home.
Original Mortgage
$315,000
Outstanding Balance
$279,744
Interest Rate
3.3%
Mortgage Type
New Conventional
Estimated Equity
$199,232
Purchase Details
Closed on
Oct 14, 2019
Sold by
Frappier Elizabeth A and Conley Mary E
Bought by
Desmond Donna
Create a Home Valuation Report for This Property
The Home Valuation Report is an in-depth analysis detailing your home's value as well as a comparison with similar homes in the area
Home Values in the Area
Average Home Value in this Area
Purchase History
| Date | Buyer | Sale Price | Title Company |
|---|---|---|---|
| Yan Marady | $350,000 | None Available | |
| Desmond Donna | $190,000 | -- |
Source: Public Records
Mortgage History
| Date | Status | Borrower | Loan Amount |
|---|---|---|---|
| Open | Yan Marady | $315,000 |
Source: Public Records
Tax History
| Year | Tax Paid | Tax Assessment Tax Assessment Total Assessment is a certain percentage of the fair market value that is determined by local assessors to be the total taxable value of land and additions on the property. | Land | Improvement |
|---|---|---|---|---|
| 2025 | $4,470 | $389,400 | $124,000 | $265,400 |
| 2024 | $4,171 | $350,200 | $100,000 | $250,200 |
| 2023 | $3,874 | $311,900 | $81,700 | $230,200 |
| 2022 | $3,553 | $280,000 | $72,400 | $207,600 |
| 2021 | $3,317 | $246,400 | $62,900 | $183,500 |
| 2020 | $3,137 | $234,800 | $81,400 | $153,400 |
| 2019 | $2,843 | $202,500 | $71,500 | $131,000 |
| 2018 | $2,719 | $193,100 | $68,100 | $125,000 |
| 2017 | $2,684 | $179,900 | $61,900 | $118,000 |
| 2016 | $2,548 | $168,100 | $60,200 | $107,900 |
| 2015 | $2,437 | $157,400 | $57,600 | $99,800 |
| 2013 | $2,283 | $152,100 | $63,600 | $88,500 |
Source: Public Records
Map
Nearby Homes
- 45 W 4th St
- 27-29 Fifth St
- 99 W 6th St
- 25 Read St
- 94 1st St Unit 10
- 105 3rd St
- 106 Methuen St Unit B
- 130 John St Unit G45
- 130 John St Unit 350
- 130 John St Unit G01
- 130 John St Unit 242
- 130 John St Unit 250
- 18 May St
- 27 Bunker Hill Ave
- 192 1st St
- 174 River Rd
- 3 Vernon St
- 10 Kearney Square Unit 407
- 9 Central St Unit 601
- 9 Central St Unit 602
- 29 W 5th St
- 37 W 5th St
- 24 W 6th St
- 24 W 6th St Unit 1st Floor
- 24 W 6th St
- 23 W 5th St Unit 1B
- 23 W 5th St Unit 2
- 23 W 5th St Unit 3
- 23 W 5th St Unit 3 rd floor
- 39 W 5th St
- 30 W 6th St
- 20 W 6th St
- 38 W 5th St
- 45 W 5th St
- 45 W 5th St Unit 2
- 32 W 5th St
- 34 W 6th St
- 34 W 6th St Unit 1
- 34 W 6th St Unit 2
- 34 W 6th St Unit 3
Your Personal Tour Guide
Ask me questions while you tour the home.