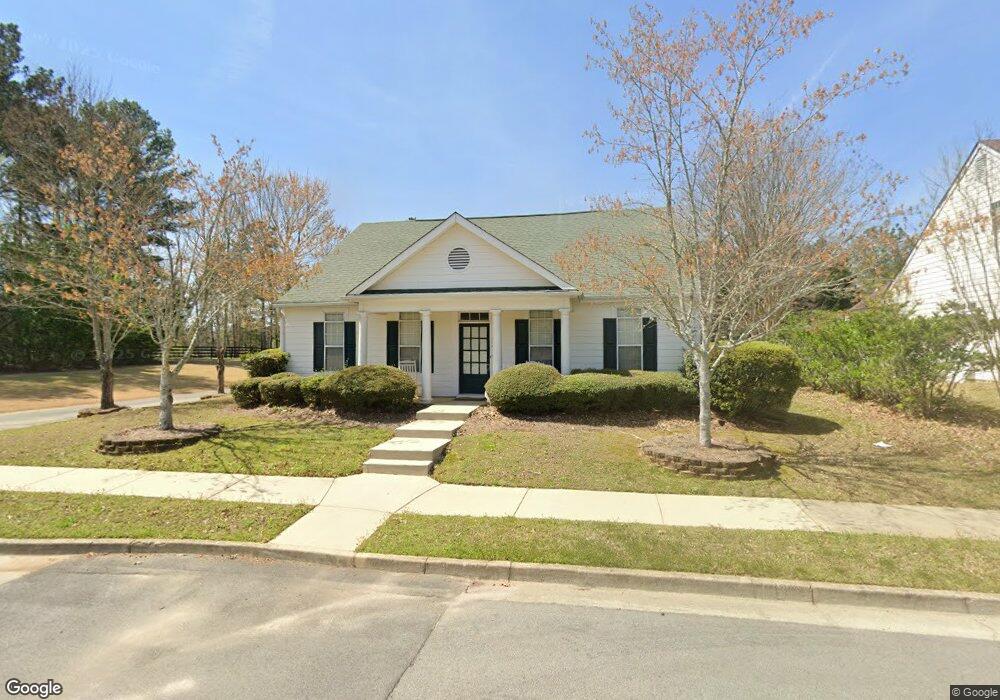
550 Anglewood Trace Stockbridge, GA 30281
Estimated Value: $279,000 - $302,000
3
Beds
2
Baths
1,632
Sq Ft
$176/Sq Ft
Est. Value
About This Home
This home is located at 550 Anglewood Trace, Stockbridge, GA 30281 and is currently estimated at $287,517, approximately $176 per square foot. 550 Anglewood Trace is a home located in Henry County with nearby schools including Red Oak Elementary School, Dutchtown Middle School, and Dutchtown High School.
Ownership History
Date
Name
Owned For
Owner Type
Purchase Details
Closed on
Jul 6, 2010
Sold by
Jeune Karl H
Bought by
Grogan William
Current Estimated Value
Purchase Details
Closed on
Mar 30, 2007
Sold by
Us Bk Na
Bought by
Jeune Karl H
Home Financials for this Owner
Home Financials are based on the most recent Mortgage that was taken out on this home.
Original Mortgage
$136,350
Interest Rate
7.88%
Mortgage Type
New Conventional
Purchase Details
Closed on
Nov 7, 2006
Sold by
Williams Shekia
Bought by
Us Bank Na
Purchase Details
Closed on
Jun 29, 2001
Sold by
Mckenzie-Perry Homes Inc
Bought by
Kean Charles A and Kean Kyong H
Home Financials for this Owner
Home Financials are based on the most recent Mortgage that was taken out on this home.
Original Mortgage
$154,900
Interest Rate
7.23%
Mortgage Type
New Conventional
Create a Home Valuation Report for This Property
The Home Valuation Report is an in-depth analysis detailing your home's value as well as a comparison with similar homes in the area
Home Values in the Area
Average Home Value in this Area
Purchase History
| Date | Buyer | Sale Price | Title Company |
|---|---|---|---|
| Grogan William | $55,506 | -- | |
| Jeune Karl H | $151,500 | -- | |
| Us Bank Na | $129,600 | -- | |
| Kean Charles A | $163,200 | -- |
Source: Public Records
Mortgage History
| Date | Status | Borrower | Loan Amount |
|---|---|---|---|
| Previous Owner | Jeune Karl H | $136,350 | |
| Previous Owner | Kean Charles A | $154,900 |
Source: Public Records
Tax History Compared to Growth
Tax History
| Year | Tax Paid | Tax Assessment Tax Assessment Total Assessment is a certain percentage of the fair market value that is determined by local assessors to be the total taxable value of land and additions on the property. | Land | Improvement |
|---|---|---|---|---|
| 2025 | $3,641 | $119,680 | $18,000 | $101,680 |
| 2024 | $3,641 | $116,600 | $18,000 | $98,600 |
| 2023 | $2,966 | $108,520 | $14,000 | $94,520 |
| 2022 | $2,783 | $94,040 | $14,000 | $80,040 |
| 2021 | $2,300 | $74,000 | $12,000 | $62,000 |
| 2020 | $2,239 | $71,280 | $10,000 | $61,280 |
| 2019 | $2,078 | $68,360 | $10,000 | $58,360 |
| 2018 | $1,956 | $63,320 | $10,000 | $53,320 |
| 2016 | $1,746 | $54,560 | $10,000 | $44,560 |
| 2015 | $1,676 | $51,160 | $7,200 | $43,960 |
| 2014 | $1,499 | $43,240 | $6,400 | $36,840 |
Source: Public Records
Map
Nearby Homes
- 540 Anglewood Trace
- 623 Brookwater Dr
- 602 Brookwater Dr
- 520 Monarch Lake Way
- 223 Monarch Village Way
- 266 Monarch Village Way
- 687 Pathwood Ln
- 591 Creek Valley Ct
- 117 Titan Rd
- 300 Monarch Village Way
- 3916 Champagne Dr
- 512 Chaucer Way Unit 1
- 705 Brentwood Pkwy
- 213 Sunderland Way Unit 1
- 568 Ransom Way
- 200 Ernestine Way
- 9055 Kelly Ct
- 1341 Kent Manor Unit 3
- 9056 Chestnut Lake Dr
- 548 Anglewood Trace
- 546 Anglewood Trace
- 161 Tumble Run Unit 19
- 161 Tumble Run
- 165 Tumble Run Unit 18
- 165 Tumble Run
- 523 Anglewood Trace
- 544 Anglewood Trace
- 157 Tumble Run Unit 20
- 157 Tumble Run
- 169 Tumble Run Unit 17
- 169 Tumble Run
- 525 Anglewood Trace
- 542 Anglewood Trace
- 153 Tumble Run Unit 21
- 153 Tumble Run
- 625 Brookwater Dr
- 527 Anglewood Trace
- 173 Tumble Run Unit 16
- 173 Tumble Run