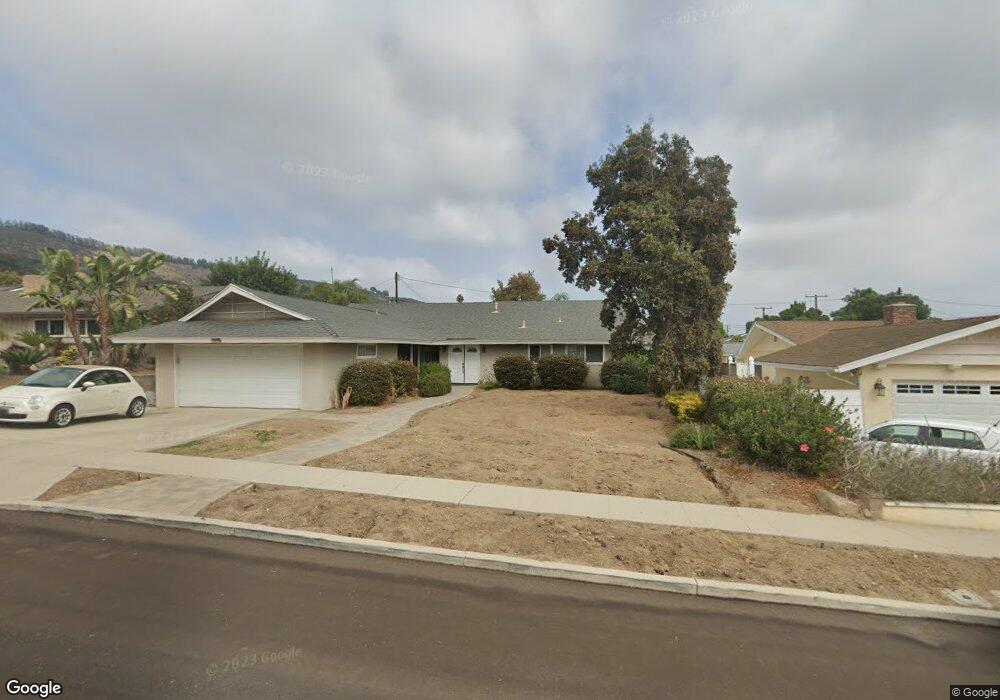
550 Beverly Cir Camarillo, CA 93010
Estimated Value: $777,000 - $1,003,000
3
Beds
2
Baths
1,633
Sq Ft
$559/Sq Ft
Est. Value
About This Home
This home is located at 550 Beverly Cir, Camarillo, CA 93010 and is currently estimated at $913,259, approximately $559 per square foot. 550 Beverly Cir is a home located in Ventura County with nearby schools including Camarillo Heights Elementary School, Monte Vista Middle School, and Adolfo Camarillo High School.
Ownership History
Date
Name
Owned For
Owner Type
Purchase Details
Closed on
Jan 6, 2020
Sold by
Sampson Amanda
Bought by
Sampson Noel
Current Estimated Value
Purchase Details
Closed on
Aug 13, 2012
Sold by
Ford Carol Mary and Mcguire Juliette Ann
Bought by
Sampson Noel and Sampson Amanda
Home Financials for this Owner
Home Financials are based on the most recent Mortgage that was taken out on this home.
Original Mortgage
$336,000
Interest Rate
3.49%
Mortgage Type
New Conventional
Purchase Details
Closed on
Feb 1, 2012
Sold by
Ford Carol Mary
Bought by
Ford Carol Mary and Mcguire Juliette Ann
Purchase Details
Closed on
Jan 21, 1997
Sold by
Fuse Juliette J and Fuse Juliette
Bought by
The 1996 Juliette Fuse Living Trust and Fuse Juliette Josephine
Create a Home Valuation Report for This Property
The Home Valuation Report is an in-depth analysis detailing your home's value as well as a comparison with similar homes in the area
Home Values in the Area
Average Home Value in this Area
Purchase History
| Date | Buyer | Sale Price | Title Company |
|---|---|---|---|
| Sampson Noel | -- | None Available | |
| Sampson Noel | $420,000 | Chicago Title Company | |
| Ford Carol Mary | -- | None Available | |
| The 1996 Juliette Fuse Living Trust | -- | -- |
Source: Public Records
Mortgage History
| Date | Status | Borrower | Loan Amount |
|---|---|---|---|
| Previous Owner | Sampson Noel | $336,000 |
Source: Public Records
Tax History
| Year | Tax Paid | Tax Assessment Tax Assessment Total Assessment is a certain percentage of the fair market value that is determined by local assessors to be the total taxable value of land and additions on the property. | Land | Improvement |
|---|---|---|---|---|
| 2025 | $3,862 | $354,264 | $163,101 | $191,163 |
| 2024 | $3,862 | $347,318 | $159,903 | $187,415 |
| 2023 | $3,723 | $340,508 | $156,767 | $183,741 |
| 2022 | $3,710 | $333,832 | $153,693 | $180,139 |
| 2021 | $3,577 | $327,287 | $150,680 | $176,607 |
| 2020 | $3,563 | $323,934 | $149,136 | $174,798 |
| 2019 | $3,545 | $317,583 | $146,212 | $171,371 |
| 2018 | $3,479 | $311,357 | $143,346 | $168,011 |
| 2017 | $3,274 | $305,253 | $140,536 | $164,717 |
| 2016 | $3,195 | $299,269 | $137,781 | $161,488 |
| 2015 | $3,161 | $294,775 | $135,712 | $159,063 |
| 2014 | $3,087 | $289,003 | $133,054 | $155,949 |
Source: Public Records
Map
Nearby Homes
- 559 N Loop Dr
- 567 Mesa Dr
- 2274 Via Tomas
- 641 LOT B Ocean View Dr
- 2496 Parkway Dr
- 2533 Antonio Dr Unit 301
- 2623 Antonio Dr Unit 106
- 2713 Antonio Dr Unit 312
- 2803 Antonio Dr Unit 204
- 2696 Antonio Dr
- 3429 Rio Hato Ct
- 3409 Reseda Ct
- 1820 Temple Ave
- 2086 El Rancho Dr
- 520 E Highland Dr
- 542 San Clemente Way
- 1769 Fenmore Ave
- 2436 Kimberly Ave
- 999 San Clemente Way
- 2103 Euclid Ave
Your Personal Tour Guide
Ask me questions while you tour the home.