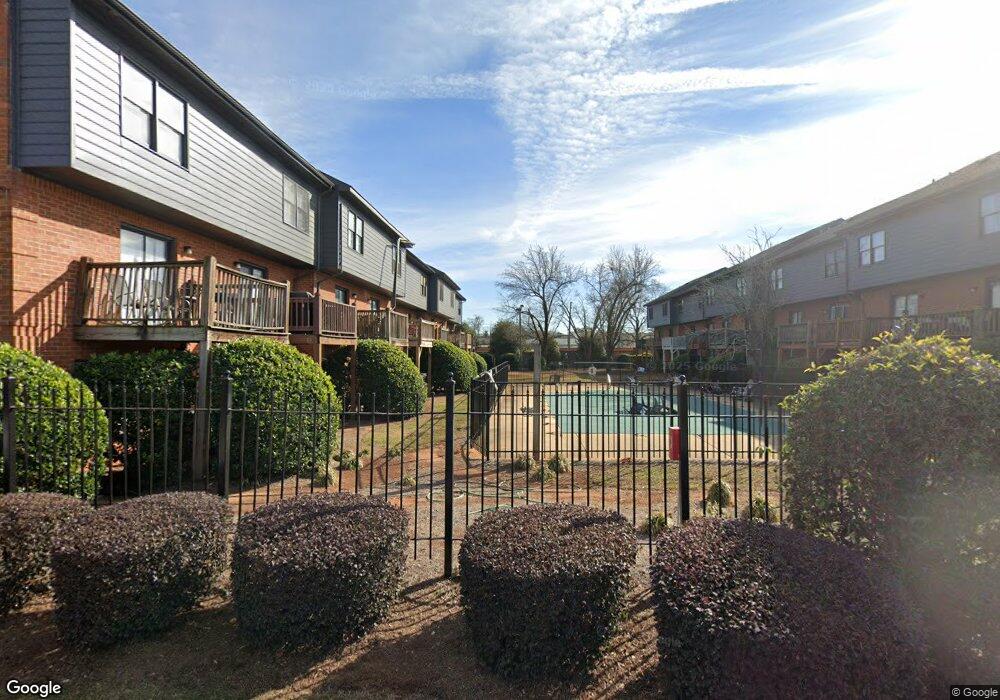
550 Dearing St Athens, GA 30606
Baxter NeighborhoodEstimated Value: $324,000 - $376,000
--
Bed
--
Bath
1,184
Sq Ft
$292/Sq Ft
Est. Value
About This Home
This home is located at 550 Dearing St, Athens, GA 30606 and is currently estimated at $346,271, approximately $292 per square foot. 550 Dearing St is a home located in Clarke County with nearby schools including Bettye Henderson Holston Elementary School, Clarke Middle School, and Clarke Central High School.
Ownership History
Date
Name
Owned For
Owner Type
Purchase Details
Closed on
Apr 27, 2017
Sold by
Coplon David S
Bought by
Geiser Morgan F and Geiser James F
Current Estimated Value
Home Financials for this Owner
Home Financials are based on the most recent Mortgage that was taken out on this home.
Original Mortgage
$90,000
Outstanding Balance
$74,550
Interest Rate
4.13%
Mortgage Type
New Conventional
Estimated Equity
$271,721
Purchase Details
Closed on
Feb 20, 2004
Sold by
Womble Charlie L
Bought by
Coplon David S and Coplon Coplon
Purchase Details
Closed on
Jul 27, 2002
Sold by
Blanchard Martin G
Bought by
Womble Charlie L
Purchase Details
Closed on
Jul 22, 1998
Sold by
Rutherford Randy J and Rutherford Cynthia M
Bought by
Blanchard Martin G
Purchase Details
Closed on
Aug 28, 1993
Sold by
Register Kevin Walter
Bought by
Rutherford Randy J and Rutherford Cynthia M
Create a Home Valuation Report for This Property
The Home Valuation Report is an in-depth analysis detailing your home's value as well as a comparison with similar homes in the area
Home Values in the Area
Average Home Value in this Area
Purchase History
| Date | Buyer | Sale Price | Title Company |
|---|---|---|---|
| Geiser Morgan F | $120,000 | -- | |
| Coplon David S | $125,000 | -- | |
| Womble Charlie L | $92,600 | -- | |
| Blanchard Martin G | $75,000 | -- | |
| Rutherford Randy J | $59,000 | -- |
Source: Public Records
Mortgage History
| Date | Status | Borrower | Loan Amount |
|---|---|---|---|
| Open | Geiser Morgan F | $90,000 |
Source: Public Records
Tax History Compared to Growth
Tax History
| Year | Tax Paid | Tax Assessment Tax Assessment Total Assessment is a certain percentage of the fair market value that is determined by local assessors to be the total taxable value of land and additions on the property. | Land | Improvement |
|---|---|---|---|---|
| 2025 | $3,784 | $121,853 | $12,000 | $109,853 |
| 2024 | $3,784 | $113,698 | $12,000 | $101,698 |
| 2023 | $3,553 | $87,721 | $12,000 | $75,721 |
| 2022 | $2,104 | $65,951 | $12,000 | $53,951 |
| 2021 | $1,986 | $58,937 | $12,000 | $46,937 |
| 2020 | $1,835 | $54,455 | $9,600 | $44,855 |
| 2019 | $1,611 | $47,441 | $9,600 | $37,841 |
| 2018 | $1,588 | $46,760 | $9,600 | $37,160 |
| 2017 | $0 | $42,686 | $9,600 | $33,086 |
| 2016 | $1,316 | $38,756 | $9,600 | $29,156 |
| 2015 | $1,363 | $40,082 | $9,600 | $30,482 |
| 2014 | $1,351 | $39,673 | $8,800 | $30,873 |
Source: Public Records
Map
Nearby Homes
- 500 Dearing St Unit 6
- 597 Dearing St
- 1226 W Broad St
- 1198 W West Hancock Ave W
- 1196 W Hancock Ave Unit 1
- 480 N Billups St
- 365 S Church St Unit 1A, 1B, 1C
- 468 N Milledge Ave Unit 203
- 1398 W Hancock Ave
- 494 Baxter St Unit 32
- 257 Hill St
- 552 Cobb St
- 255 Bloomfield St
- 338 Springdale St
- 265 Springdale St
- 570 Prince Ave
- 1055 Baxter St Unit 504
- 283 King Ave
- 50 Springdale St
- 525 King Ave
- 550 Dearing St Unit 4
- 550 Dearing St Unit 27
- 550 Dearing St Unit 16
- 550 Dearing St Unit 15
- 550 Dearing St Unit 29
- 550 Dearing St Unit 19
- 550 Dearing St Unit 3
- 550 Dearing St Unit 1
- 550 Dearing St Unit 12
- 550 Dearing St Unit 25
- 550 Dearing St Unit 18
- 550 Dearing St
- 550 Dearing St
- 550 Dearing St
- 550 Dearing St
- 550 Dearing St
- 550 Dearing St
- 550 Dearing St
- 550 Dearing St
- 550 Dearing St