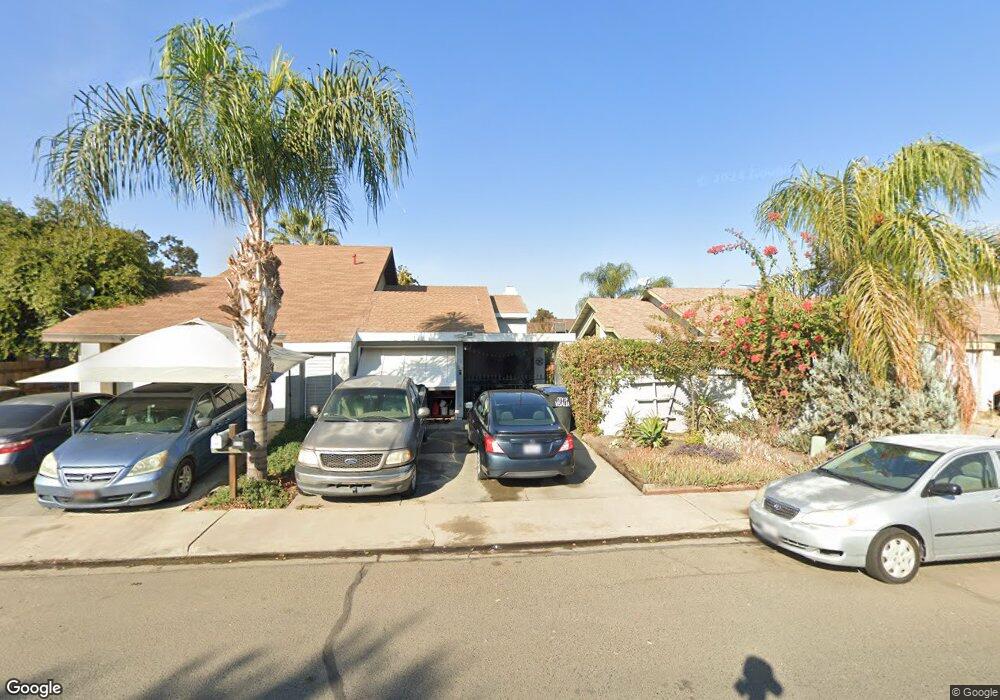
550 E Harold Ave Visalia, CA 93292
North Visalia NeighborhoodEstimated Value: $207,709 - $236,000
1
Bed
1
Bath
822
Sq Ft
$271/Sq Ft
Est. Value
About This Home
This home is located at 550 E Harold Ave, Visalia, CA 93292 and is currently estimated at $222,927, approximately $271 per square foot. 550 E Harold Ave is a home located in Tulare County with nearby schools including Four Creeks Elementary School, Valley Oak Middle School, and Golden West High School.
Ownership History
Date
Name
Owned For
Owner Type
Purchase Details
Closed on
Nov 16, 2023
Sold by
Wheaton Craig Eugene
Bought by
2023 Craig E Wheaton Separate Property Trust and Wheaton
Current Estimated Value
Purchase Details
Closed on
Nov 10, 2023
Sold by
Wheaton Craig Eugene
Bought by
2023 Craig E Wheaton Separate Property Trust and Wheaton
Purchase Details
Closed on
Sep 22, 2016
Sold by
Wheaton Craig Eugene
Bought by
Wheaton Craig Eugene
Purchase Details
Closed on
Oct 7, 2013
Sold by
Wheaton Barbara
Bought by
Wheaton Craig Eugene and Wheaton Barbara Doreen
Purchase Details
Closed on
Feb 3, 2004
Sold by
Wheaton Craig E
Bought by
Wheaton Barbara
Purchase Details
Closed on
Jan 28, 2004
Sold by
Bautista Jose
Bought by
Wheaton Barbara
Purchase Details
Closed on
Jan 24, 1996
Sold by
Vreeland Ann Marie
Bought by
Bautista Jose and Bautista Maria
Create a Home Valuation Report for This Property
The Home Valuation Report is an in-depth analysis detailing your home's value as well as a comparison with similar homes in the area
Home Values in the Area
Average Home Value in this Area
Purchase History
| Date | Buyer | Sale Price | Title Company |
|---|---|---|---|
| 2023 Craig E Wheaton Separate Property Trust | -- | None Listed On Document | |
| 2023 Craig E Wheaton Separate Property Trust | -- | None Listed On Document | |
| Wheaton Craig Eugene | -- | None Available | |
| Wheaton Craig Eugene | -- | None Available | |
| Wheaton Barbara | -- | Chicago Title Co | |
| Wheaton Barbara | $60,000 | Chicago Title Co | |
| Bautista Jose | -- | Fidelity National Title |
Source: Public Records
Tax History
| Year | Tax Paid | Tax Assessment Tax Assessment Total Assessment is a certain percentage of the fair market value that is determined by local assessors to be the total taxable value of land and additions on the property. | Land | Improvement |
|---|---|---|---|---|
| 2025 | $950 | $85,301 | $24,879 | $60,422 |
| 2024 | $950 | $83,630 | $24,392 | $59,238 |
| 2023 | $925 | $81,991 | $23,914 | $58,077 |
| 2022 | $886 | $80,385 | $23,446 | $56,939 |
| 2021 | $887 | $78,809 | $22,986 | $55,823 |
| 2020 | $875 | $78,001 | $22,750 | $55,251 |
| 2019 | $856 | $76,472 | $22,304 | $54,168 |
| 2018 | $831 | $74,973 | $21,867 | $53,106 |
| 2017 | $828 | $73,503 | $21,438 | $52,065 |
| 2016 | $808 | $72,062 | $21,018 | $51,044 |
| 2015 | $808 | $70,979 | $20,702 | $50,277 |
| 2014 | $786 | $69,588 | $20,296 | $49,292 |
Source: Public Records
Map
Nearby Homes
- 219 E Elowin Ct
- 203 E Harold Ct
- 201 E Elowin Ct
- 315 NE 3rd Ave
- 636 E Roosevelt Ave
- 1420 N Court St
- 1432 N Locust St
- 1215 N Court St
- 223 W Buena Vista Ave
- 1540 N Encina St
- 632 E Douglas Ave
- 811 E Trinidad Ave
- 2241 N Edison St
- 1205 E Ferguson Ave
- 2234 N Edison St
- 125 N Hicks St Unit B
- 125 N Hicks St Unit A
- 704 N Garden St
- 1217 E Ferguson Ave
- 1301 N Enos St
- 548 E Harold Ave
- 606 E Harold Ave
- 544 E Harold Ave
- 610 E Harold Ave
- 1736 N Tipton St
- 616 E Harold Ave
- 549 E Prospect Ave
- 547 E Prospect Ave
- 603 E Prospect Ave
- 545 E Prospect Ave
- 620 E Harold Ave
- 611 E Prospect Ave
- 1748 N Tipton St
- 549 E Harold Ave
- 547 E Harold Ave
- 617 E Prospect Ave
- 605 E Harold Ave
- 626 E Harold Ave
- 543 E Harold Ave
- 609 E Harold Ave
Your Personal Tour Guide
Ask me questions while you tour the home.