Estimated Value: $511,053 - $571,000
3
Beds
2
Baths
1,462
Sq Ft
$375/Sq Ft
Est. Value
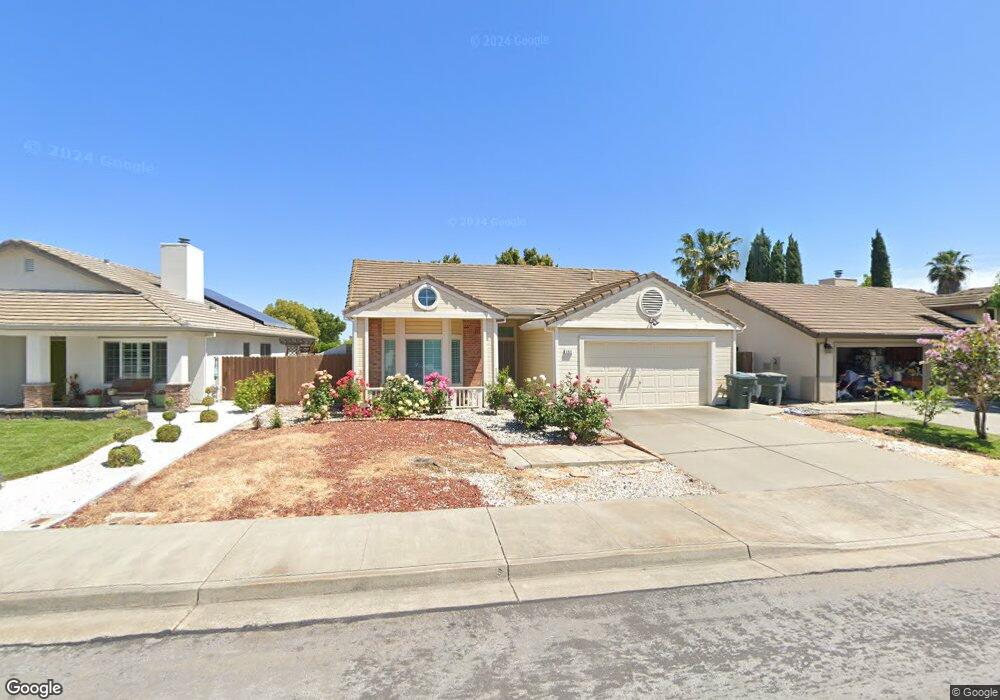
About This Home
This home is located at 550 Evans Rd, Dixon, CA 95620 and is currently estimated at $548,263, approximately $375 per square foot. 550 Evans Rd is a home located in Solano County with nearby schools including Tremont Elementary School, Dixon High School, and Dixon Montessori Charter.
Ownership History
Date
Name
Owned For
Owner Type
Purchase Details
Closed on
Feb 28, 2017
Sold by
Chung Kwok Ming and Chu Anna Onnar
Bought by
Chung Kwok Ming and Chu Anna Onnar
Current Estimated Value
Purchase Details
Closed on
Dec 5, 1994
Sold by
Forecast Group L P
Bought by
Chung Kwok Ming and Chu Anna On Nar
Home Financials for this Owner
Home Financials are based on the most recent Mortgage that was taken out on this home.
Original Mortgage
$111,990
Interest Rate
3.87%
Create a Home Valuation Report for This Property
The Home Valuation Report is an in-depth analysis detailing your home's value as well as a comparison with similar homes in the area
Home Values in the Area
Average Home Value in this Area
Purchase History
| Date | Buyer | Sale Price | Title Company |
|---|---|---|---|
| Chung Kwok Ming | -- | None Available | |
| Chung Kwok Ming | $140,000 | First American Title Guarant |
Source: Public Records
Mortgage History
| Date | Status | Borrower | Loan Amount |
|---|---|---|---|
| Closed | Chung Kwok Ming | $111,990 |
Source: Public Records
Tax History
| Year | Tax Paid | Tax Assessment Tax Assessment Total Assessment is a certain percentage of the fair market value that is determined by local assessors to be the total taxable value of land and additions on the property. | Land | Improvement |
|---|---|---|---|---|
| 2025 | $2,753 | $241,522 | $81,962 | $159,560 |
| 2024 | $2,753 | $236,787 | $80,355 | $156,432 |
| 2023 | $2,672 | $232,145 | $78,780 | $153,365 |
| 2022 | $2,632 | $227,594 | $77,236 | $150,358 |
| 2021 | $2,598 | $223,132 | $75,722 | $147,410 |
| 2020 | $2,556 | $220,845 | $74,946 | $145,899 |
| 2019 | $2,507 | $216,516 | $73,477 | $143,039 |
| 2018 | $2,495 | $212,272 | $72,037 | $140,235 |
| 2017 | $2,432 | $208,111 | $70,625 | $137,486 |
| 2016 | $2,323 | $204,032 | $69,241 | $134,791 |
| 2015 | $2,270 | $200,968 | $68,201 | $132,767 |
| 2014 | $2,244 | $197,033 | $66,866 | $130,167 |
Source: Public Records
Map
Nearby Homes
- 1845 Derby Dr
- 690 Woodard Way
- 2035 Rehrmann Dr
- 675 Brians Way
- 265 Ahern Ln
- 1530 Ferrero Dr
- 1365 Jacobs Place
- 1315 Jacobs Place
- 525 Fruit Tree Rd
- 2100 Lark Way
- 2130 Lark Way
- 1770 Butterfly Ln
- 1330 Blackberry Ct
- 315 White Owl St
- 1025 Mason Ct
- 1315 Pinewood Ct
- 2310 Lark Way
- 1250 Redwood Ct
- 1155 Mulberry Ln
- 1150 Mulberry Ln
Your Personal Tour Guide
Ask me questions while you tour the home.