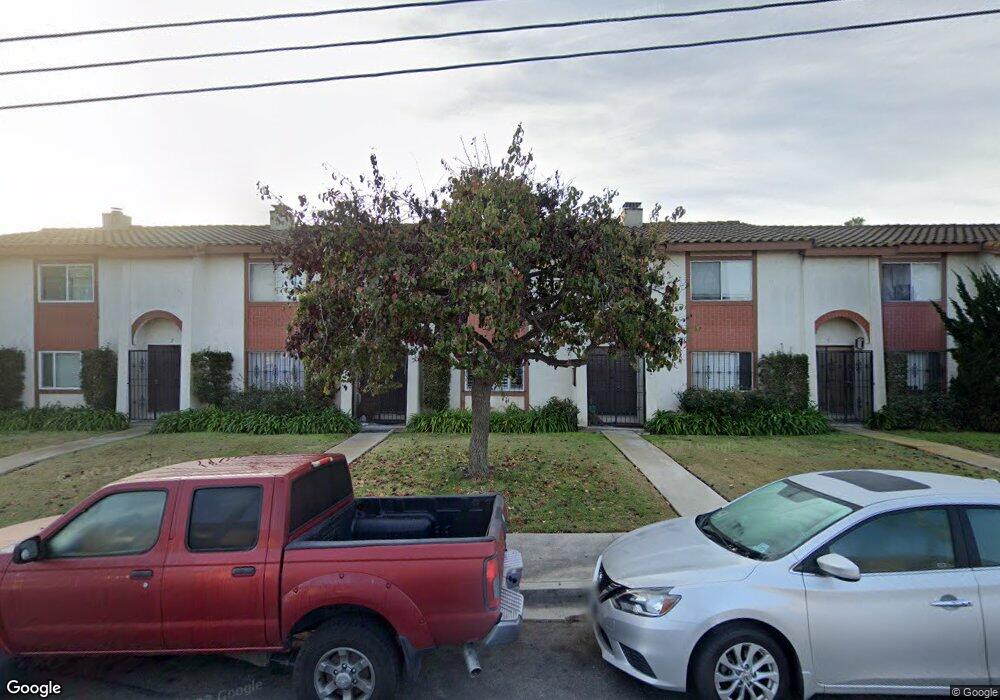
550 Park Way Unit 1 Chula Vista, CA 91910
Downtown Chula Vista NeighborhoodEstimated Value: $461,000 - $534,000
2
Beds
2
Baths
1,144
Sq Ft
$439/Sq Ft
Est. Value
About This Home
This home is located at 550 Park Way Unit 1, Chula Vista, CA 91910 and is currently estimated at $501,865, approximately $438 per square foot. 550 Park Way Unit 1 is a home located in San Diego County with nearby schools including Vista Square Elementary School, Chula Vista Middle School, and Chula Vista High School.
Ownership History
Date
Name
Owned For
Owner Type
Purchase Details
Closed on
Oct 8, 2003
Sold by
Barragan Roberto and Barragan Hermila
Bought by
Flores Juan J and Carrillo Irma J
Current Estimated Value
Home Financials for this Owner
Home Financials are based on the most recent Mortgage that was taken out on this home.
Original Mortgage
$187,425
Outstanding Balance
$79,356
Interest Rate
4.87%
Mortgage Type
Credit Line Revolving
Estimated Equity
$422,509
Purchase Details
Closed on
Apr 3, 2002
Sold by
Barragam Roberto and Barragam Hermila
Bought by
Barragan Roberto and Barragan Hermila
Home Financials for this Owner
Home Financials are based on the most recent Mortgage that was taken out on this home.
Original Mortgage
$10,000
Interest Rate
6.78%
Purchase Details
Closed on
Aug 7, 1997
Sold by
Barragan Roberto and Barragan Hermila
Bought by
Barragan Roberto and Barragan Hermila
Purchase Details
Closed on
Jul 22, 1997
Sold by
Parziale James V
Bought by
Barragan Roberto and Barragan Hermila
Create a Home Valuation Report for This Property
The Home Valuation Report is an in-depth analysis detailing your home's value as well as a comparison with similar homes in the area
Home Values in the Area
Average Home Value in this Area
Purchase History
| Date | Buyer | Sale Price | Title Company |
|---|---|---|---|
| Flores Juan J | $250,000 | Commerce Title Company | |
| Barragan Roberto | -- | Gateway Title Company | |
| Barragan Roberto | -- | -- | |
| Barragan Roberto | $80,000 | -- |
Source: Public Records
Mortgage History
| Date | Status | Borrower | Loan Amount |
|---|---|---|---|
| Open | Flores Juan J | $187,425 | |
| Previous Owner | Barragan Roberto | $10,000 | |
| Closed | Flores Juan J | $37,485 |
Source: Public Records
Tax History Compared to Growth
Tax History
| Year | Tax Paid | Tax Assessment Tax Assessment Total Assessment is a certain percentage of the fair market value that is determined by local assessors to be the total taxable value of land and additions on the property. | Land | Improvement |
|---|---|---|---|---|
| 2025 | $4,020 | $355,285 | $142,171 | $213,114 |
| 2024 | $4,020 | $348,320 | $139,384 | $208,936 |
| 2023 | $3,964 | $341,491 | $136,651 | $204,840 |
| 2022 | $3,849 | $334,796 | $133,972 | $200,824 |
| 2021 | $3,373 | $295,000 | $112,000 | $183,000 |
| 2020 | $3,155 | $280,000 | $107,000 | $173,000 |
| 2019 | $3,021 | $270,000 | $104,000 | $166,000 |
| 2018 | $2,919 | $260,000 | $101,000 | $159,000 |
| 2017 | $2,630 | $235,000 | $92,000 | $143,000 |
| 2016 | $2,108 | $190,000 | $75,000 | $115,000 |
| 2015 | $1,871 | $169,000 | $67,000 | $102,000 |
| 2014 | $1,716 | $155,000 | $62,000 | $93,000 |
Source: Public Records
Map
Nearby Homes
- 536 Park Way Unit 41,42
- 677 G St Unit 103.5
- 677 G St Unit 51
- 677 G St Unit 161
- 691 G St
- 456 Davidson St
- 429 Woodlawn Ave Unit D
- 376 Center St Unit 304
- 490 Fourth Ave Unit 21
- 731 G St Unit SPC E10
- Plan1 at Citrus Bay - The Courts
- Plan 2 at Citrus Bay - The Courts
- Plan 3 at Citrus Bay - The Courts
- 465 Fourth Ave Unit 17
- 465 Fourth Ave Unit 14
- 475 4th Ave Unit H
- 471 4th Ave Unit B
- Plan 6 at Citrus Bay - The Towns
- Plan 4 at Citrus Bay - The Towns
- Plan 2 at Citrus Bay - The Towns
- 551 G St Unit 3
- 551 G St Unit 2
- 551 G St Unit 1
- 551 G St Unit 4
- 551 G St Unit 5
- 551 G St Unit 6
- 551 G St Unit 7
- 551 G St Unit 8
- 550 Park Way Unit 8
- 550 Park Way Unit 7
- 550 Park Way Unit 6
- 550 Park Way Unit 5
- 550 Park Way Unit 4
- 550 Park Way Unit 3
- 550 Park Way Unit 2
- 554 Park Way
- 541 G St Unit 43
- 553 G St
- 536 Park Way
- 535 G St