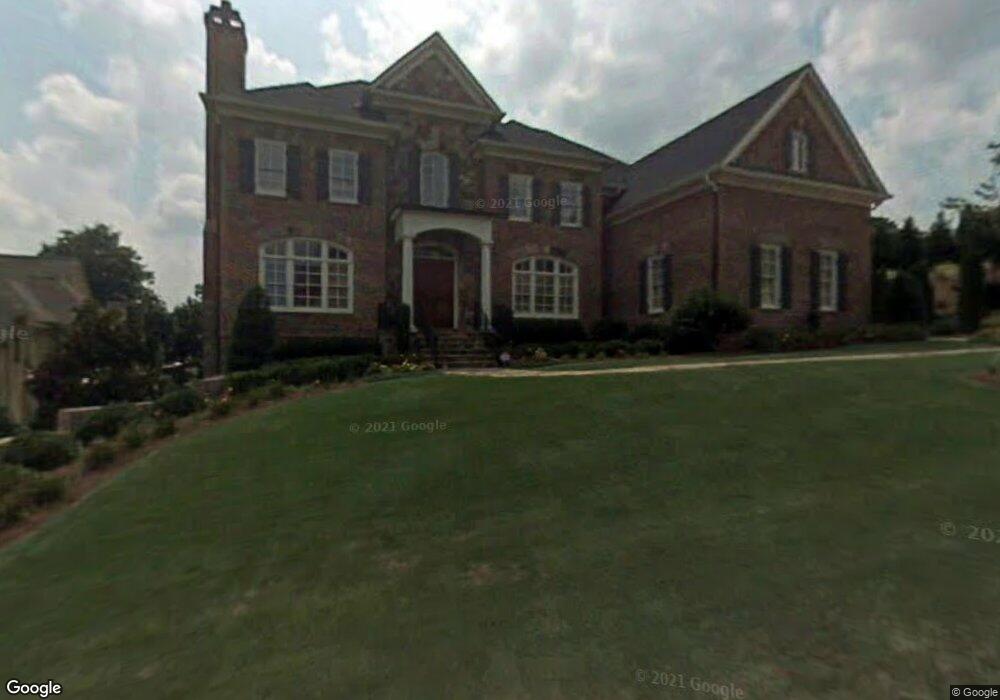
550 Rivercliff Trace Unit 2 Marietta, GA 30067
Atlanta Country Club Estates NeighborhoodEstimated Value: $1,942,442 - $2,165,000
5
Beds
7
Baths
5,605
Sq Ft
$368/Sq Ft
Est. Value
About This Home
This home is located at 550 Rivercliff Trace Unit 2, Marietta, GA 30067 and is currently estimated at $2,061,147, approximately $367 per square foot. 550 Rivercliff Trace Unit 2 is a home located in Cobb County with nearby schools including Sope Creek Elementary School, Dickerson Middle School, and The Epstein School.
Ownership History
Date
Name
Owned For
Owner Type
Purchase Details
Closed on
Apr 10, 2006
Sold by
Hess Amanda I and Hess Maclean R
Bought by
Malsom Brian R and Malsom Dena R
Current Estimated Value
Home Financials for this Owner
Home Financials are based on the most recent Mortgage that was taken out on this home.
Original Mortgage
$1,350,000
Outstanding Balance
$788,844
Interest Rate
6.75%
Mortgage Type
New Conventional
Estimated Equity
$1,272,303
Purchase Details
Closed on
May 30, 2003
Sold by
John Labarbera Inc
Bought by
Hess Amanda I
Home Financials for this Owner
Home Financials are based on the most recent Mortgage that was taken out on this home.
Original Mortgage
$800,000
Interest Rate
5.79%
Mortgage Type
New Conventional
Create a Home Valuation Report for This Property
The Home Valuation Report is an in-depth analysis detailing your home's value as well as a comparison with similar homes in the area
Home Values in the Area
Average Home Value in this Area
Purchase History
| Date | Buyer | Sale Price | Title Company |
|---|---|---|---|
| Malsom Brian R | $1,500,000 | -- | |
| Hess Amanda I | $1,212,500 | -- | |
| John Labarbera Inc | -- | -- |
Source: Public Records
Mortgage History
| Date | Status | Borrower | Loan Amount |
|---|---|---|---|
| Open | Malsom Brian R | $1,350,000 | |
| Previous Owner | John Labarbera Inc | $800,000 |
Source: Public Records
Tax History Compared to Growth
Tax History
| Year | Tax Paid | Tax Assessment Tax Assessment Total Assessment is a certain percentage of the fair market value that is determined by local assessors to be the total taxable value of land and additions on the property. | Land | Improvement |
|---|---|---|---|---|
| 2025 | $17,510 | $628,328 | $140,000 | $488,328 |
| 2024 | $16,666 | $588,864 | $124,000 | $464,864 |
| 2023 | $15,263 | $549,204 | $124,000 | $425,204 |
| 2022 | $15,914 | $549,204 | $124,000 | $425,204 |
| 2021 | $15,269 | $519,728 | $124,000 | $395,728 |
| 2020 | $15,269 | $519,728 | $124,000 | $395,728 |
| 2019 | $15,269 | $519,728 | $124,000 | $395,728 |
| 2018 | $14,704 | $493,948 | $124,000 | $369,948 |
| 2017 | $13,934 | $493,948 | $124,000 | $369,948 |
| 2016 | $13,935 | $493,948 | $124,000 | $369,948 |
| 2015 | $12,730 | $440,944 | $124,000 | $316,944 |
| 2014 | $12,838 | $440,944 | $0 | $0 |
Source: Public Records
Map
Nearby Homes
- 4488 Doral Cir SE Unit 3
- 4571 Columns Dr SE
- 4513 Chattahoochee Way SE
- 459 Atlanta Country Club Dr SE
- 511 Pine Valley Rd SE
- 585 Amberidge Trail NW
- 720 Edgewater Trail
- 110 Robin Rd SE
- 6320 Riverside Dr
- 506 Old Harbor Dr NW
- 111 Cherry Hill Dr SE
- 502 Old Harbor Dr NW
- 4161 Thunderbird Dr SE
- 1070 Brockton Close
- 4402 Blackland Dr
- 715 Amberidge Trail NW
- 4131 Thunderbird Dr SE
- 6370 River Chase Cir NW
- 2134 River Heights Walk SE
- 4415 Blackland Dr
- 554 Rivercliff Trace
- 549 Rivercliff Trace
- 553 Rivercliff Trace
- 4721 Cliffside Ct Unit 2
- 4725 Cliffside Ct
- 558 Rivercliff Trace
- 558 Rivercliff Trace Unit 2
- 542 Rivercliff Trace Unit 2
- 561 Rivercliff Trace
- 541 Rivercliff Trace Unit 2
- 538 Rivercliff Trace
- 4750 Rivercliff Landing
- 4542 Firestone Dr SE Unit 3
- 6675 River Knoll Dr SE
- 4530 Firestone Dr SE
- 513 Rivercliff Trace
- 4758 Rivercliff Landing Unit 2
- 4762 Rivercliff Landing
- 4550 Firestone Dr SE
- 534 Rivercliff Trace