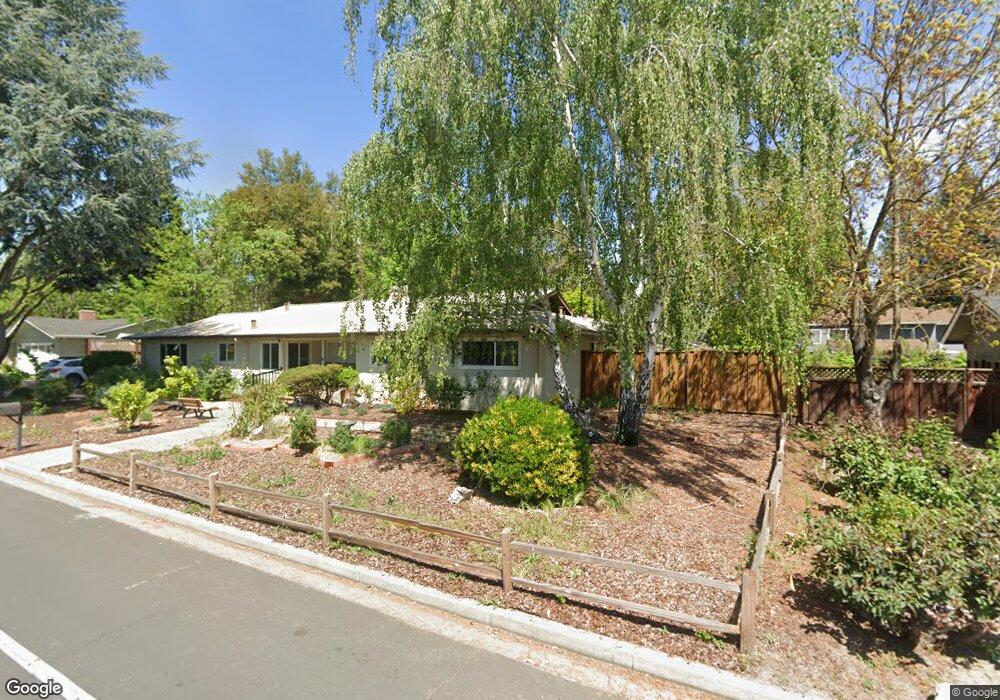
550 Sycamore Cir Danville, CA 94526
Estimated Value: $812,000 - $842,000
3
Beds
2
Baths
1,390
Sq Ft
$594/Sq Ft
Est. Value
About This Home
This home is located at 550 Sycamore Cir, Danville, CA 94526 and is currently estimated at $826,216, approximately $594 per square foot. 550 Sycamore Cir is a home located in Contra Costa County with nearby schools including John Baldwin Elementary School, Charlotte Wood Middle School, and San Ramon Valley High School.
Ownership History
Date
Name
Owned For
Owner Type
Purchase Details
Closed on
Nov 23, 2009
Sold by
Noonkester Dale A
Bought by
Noonkester Dale A and Noonkester Janet L
Current Estimated Value
Purchase Details
Closed on
Nov 17, 2009
Sold by
Noonkester Janet L
Bought by
Noonkester Dale A
Purchase Details
Closed on
Jan 2, 2009
Sold by
Noonkester Dale
Bought by
Noonkester Janet L
Purchase Details
Closed on
Jul 25, 2007
Sold by
Maryott John
Bought by
Noonkester Dale
Purchase Details
Closed on
Oct 15, 2004
Sold by
Raffanti Kevin and Raffanti Nancie
Bought by
Maryott John
Purchase Details
Closed on
Jun 11, 1999
Sold by
Dotres Maria Tre
Bought by
Raffanti Kevin and Raffanti Nancie
Home Financials for this Owner
Home Financials are based on the most recent Mortgage that was taken out on this home.
Original Mortgage
$196,000
Interest Rate
6.87%
Mortgage Type
Purchase Money Mortgage
Create a Home Valuation Report for This Property
The Home Valuation Report is an in-depth analysis detailing your home's value as well as a comparison with similar homes in the area
Home Values in the Area
Average Home Value in this Area
Purchase History
| Date | Buyer | Sale Price | Title Company |
|---|---|---|---|
| Noonkester Dale A | -- | None Available | |
| Noonkester Dale A | -- | None Available | |
| Noonkester Janet L | -- | None Available | |
| Noonkester Dale | $584,500 | Financial Title Company | |
| Maryott John | $520,000 | Financial Title | |
| Raffanti Kevin | $245,000 | Placer Title Company |
Source: Public Records
Mortgage History
| Date | Status | Borrower | Loan Amount |
|---|---|---|---|
| Previous Owner | Raffanti Kevin | $196,000 |
Source: Public Records
Tax History Compared to Growth
Tax History
| Year | Tax Paid | Tax Assessment Tax Assessment Total Assessment is a certain percentage of the fair market value that is determined by local assessors to be the total taxable value of land and additions on the property. | Land | Improvement |
|---|---|---|---|---|
| 2025 | $2,038 | $113,554 | $19,568 | $93,986 |
| 2024 | $1,992 | $111,329 | $19,185 | $92,144 |
| 2023 | $1,992 | $109,147 | $18,809 | $90,338 |
| 2022 | $1,975 | $107,008 | $18,441 | $88,567 |
| 2021 | $1,921 | $104,911 | $18,080 | $86,831 |
| 2019 | $1,839 | $101,801 | $17,545 | $84,256 |
| 2018 | $1,767 | $99,805 | $17,201 | $82,604 |
| 2017 | $1,692 | $97,849 | $16,864 | $80,985 |
| 2016 | $1,863 | $95,932 | $16,534 | $79,398 |
| 2015 | $1,820 | $94,492 | $16,286 | $78,206 |
| 2014 | $1,777 | $92,642 | $15,967 | $76,675 |
Source: Public Records
Map
Nearby Homes
- 500 Sycamore Cir
- 120 Paraiso Dr
- 175 Midland Way
- 1123 San Ramon Valley Blvd
- 90 Princeton Ct
- 931 Camino Ramon
- 17 Canary Ct
- 14 Brookstone Ln
- 131 Clover Hill Ct
- 110 Elworthy Ranch Dr
- 323 Laurel Dr
- 491 Scotts Mill Rd
- 652 Hartley Dr
- 144 Tweed Dr
- 824 Danville Blvd Lot A
- 824 Danville Blvd Lot C
- 200 Daylight Place
- 587 El Capitan Dr
- 324 Merrilee Place
- 570 Zephyr Cir
- 554 Sycamore Cir
- 558 Sycamore Cir
- 548 Sycamore Cir
- 562 Sycamore Cir
- 570 Sycamore Cir
- 540 Sycamore Cir
- 574 Sycamore Cir
- 566 Sycamore Cir
- 578 Sycamore Cir
- 536 Sycamore Cir
- 553 Sycamore Cir
- 555 Sycamore Cir
- 532 Sycamore Cir
- 551 Sycamore Cir
- 557 Sycamore Cir
- 559 Sycamore Cir
- 582 Sycamore Cir
- 547 Sycamore Cir
- 528 Sycamore Cir
- 563 Sycamore Cir