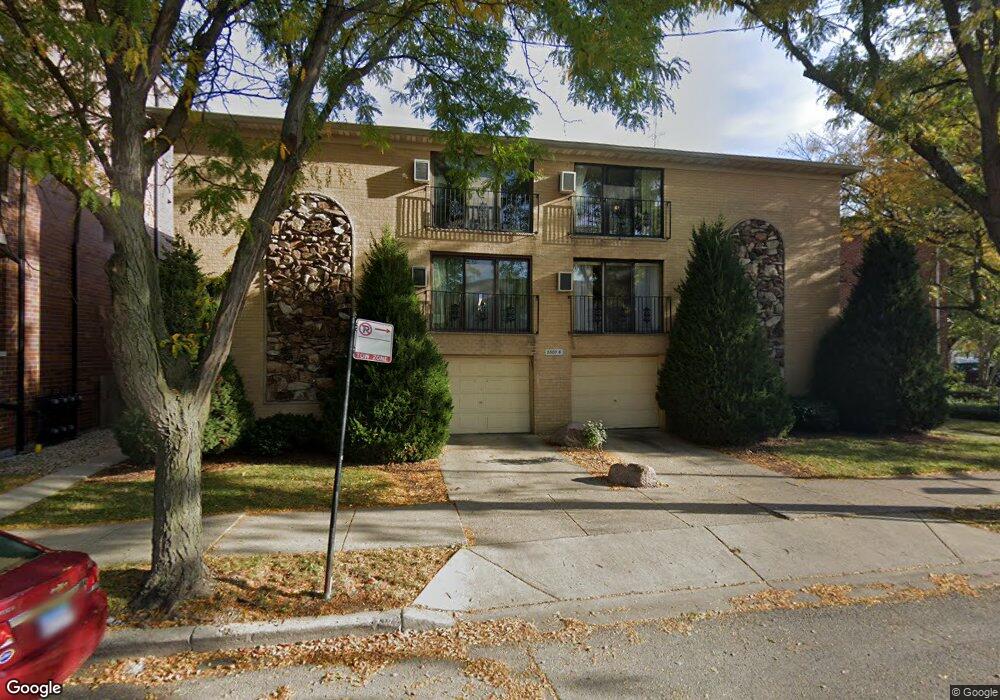
5500 W Higgins Ave Unit 55003W Chicago, IL 60630
Jefferson Park NeighborhoodEstimated Value: $204,000 - $265,000
2
Beds
1
Bath
14,250
Sq Ft
$16/Sq Ft
Est. Value
About This Home
This home is located at 5500 W Higgins Ave Unit 55003W, Chicago, IL 60630 and is currently estimated at $222,892, approximately $15 per square foot. 5500 W Higgins Ave Unit 55003W is a home located in Cook County with nearby schools including Beaubien Elementary School, Taft High School, and St. Constance School.
Ownership History
Date
Name
Owned For
Owner Type
Purchase Details
Closed on
Nov 10, 2016
Sold by
Dezonno David and Dezonno Rebecca
Bought by
Deleon Hector and Deleon Carlos A
Current Estimated Value
Home Financials for this Owner
Home Financials are based on the most recent Mortgage that was taken out on this home.
Original Mortgage
$134,100
Outstanding Balance
$111,167
Interest Rate
4.5%
Mortgage Type
New Conventional
Estimated Equity
$111,725
Purchase Details
Closed on
Aug 7, 2003
Sold by
Liebing Christina and Liebing Maria
Bought by
Dezonno David and Dezonno Rebecca
Home Financials for this Owner
Home Financials are based on the most recent Mortgage that was taken out on this home.
Original Mortgage
$161,000
Interest Rate
5.97%
Mortgage Type
Unknown
Purchase Details
Closed on
May 27, 1999
Sold by
Dalponte David and Dalponte David
Bought by
Liebing Christina and Liebing Maria
Purchase Details
Closed on
Apr 8, 1994
Sold by
Phillips Anita M
Bought by
Dalponte David A
Create a Home Valuation Report for This Property
The Home Valuation Report is an in-depth analysis detailing your home's value as well as a comparison with similar homes in the area
Home Values in the Area
Average Home Value in this Area
Purchase History
| Date | Buyer | Sale Price | Title Company |
|---|---|---|---|
| Deleon Hector | $149,000 | First American Title Insuran | |
| Dezonno David | $176,000 | Cti | |
| Liebing Christina | $108,000 | -- | |
| Dalponte David A | -- | -- | |
| Dalponte David A | -- | -- |
Source: Public Records
Mortgage History
| Date | Status | Borrower | Loan Amount |
|---|---|---|---|
| Open | Deleon Hector | $134,100 | |
| Previous Owner | Dezonno David | $161,000 |
Source: Public Records
Tax History Compared to Growth
Tax History
| Year | Tax Paid | Tax Assessment Tax Assessment Total Assessment is a certain percentage of the fair market value that is determined by local assessors to be the total taxable value of land and additions on the property. | Land | Improvement |
|---|---|---|---|---|
| 2024 | $2,329 | $16,349 | $2,539 | $13,810 |
| 2023 | $2,249 | $14,351 | $2,048 | $12,303 |
| 2022 | $2,249 | $14,351 | $2,048 | $12,303 |
| 2021 | $2,217 | $14,349 | $2,047 | $12,302 |
| 2020 | $3,129 | $17,141 | $1,187 | $15,954 |
| 2019 | $3,133 | $19,016 | $1,187 | $17,829 |
| 2018 | $3,759 | $19,016 | $1,187 | $17,829 |
| 2017 | $3,892 | $18,070 | $1,064 | $17,006 |
| 2016 | $3,121 | $18,070 | $1,064 | $17,006 |
| 2015 | $2,832 | $18,070 | $1,064 | $17,006 |
| 2014 | $2,146 | $14,125 | $982 | $13,143 |
| 2013 | $2,092 | $14,125 | $982 | $13,143 |
Source: Public Records
Map
Nearby Homes
- 4926 N Lester Ave Unit 49261W
- 4976 N Milwaukee Ave Unit 101
- 4915 N Central Ave Unit 16-3E
- 5501 W Lawrence Ave Unit 3C
- 5646 W Grover St
- 5447 W Lawrence Ave Unit 301
- 5342 W Winnemac Ave
- 4956 N Lockwood Ave Unit 1
- 5705 W Higgins Ave
- 5641 W Carmen Ave
- 5351 W Foster Ave
- 5222 W Winnemac Ave
- 5754 W Lawrence Ave Unit 1A
- 5741 W Lawrence Ave Unit 2
- 5710 W Leland Ave
- 5107 N Mango Ave
- 5431 W Wilson Ave
- 5134 W Strong St
- 5416 W Windsor Ave Unit 1N
- 5151 W Winona St
- 5500 W Higgins Ave Unit 1N
- 5500 W Higgins Ave Unit 55002E
- 5500 W Higgins Ave Unit 8
- 5500 W Higgins Ave Unit 4
- 5500 W Higgins Ave Unit 6
- 5500 W Higgins Ave Unit 7
- 5500 W Higgins Ave Unit 3
- 5500 W Higgins Ave Unit 55003E
- 5506 W Higgins Ave Unit 55063
- 5500 W Higgins Ave Unit 55001N
- 5500 W Higgins Ave Unit 5
- 5500 W Higgins Ave Unit 1
- 5500 W Higgins Ave Unit 55002W
- 5506 W Higgins Ave Unit 55062
- 5500 W Higgins Ave Unit 55061
- 5500 W Higgins Ave Unit 2
- 5500 W Higgins Ave Unit 55003N
- 5500 W Higgins Ave Unit 55002N
- 5500 W Higgins Ave Unit 3W
- 5506 W Higgins Ave Unit 3