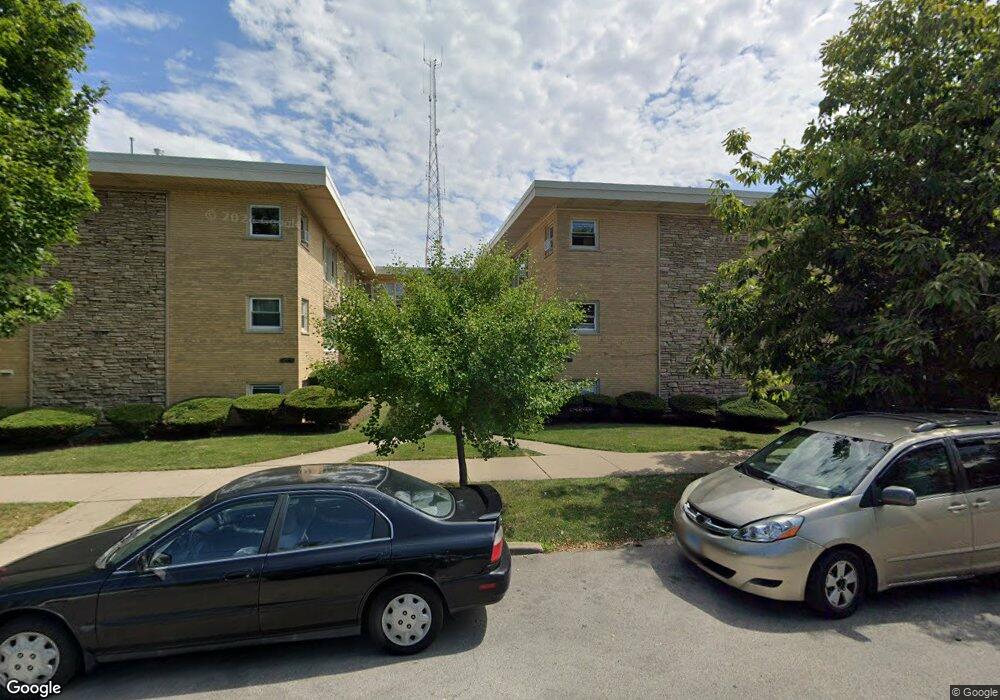
5501 W Edmunds St Unit GC Chicago, IL 60630
Jefferson Park NeighborhoodEstimated Value: $120,000 - $178,000
1
Bed
1
Bath
750
Sq Ft
$209/Sq Ft
Est. Value
About This Home
This home is located at 5501 W Edmunds St Unit GC, Chicago, IL 60630 and is currently estimated at $156,509, approximately $208 per square foot. 5501 W Edmunds St Unit GC is a home located in Cook County with nearby schools including Beaubien Elementary School, William Howard Taft High School, and St. Constance School.
Ownership History
Date
Name
Owned For
Owner Type
Purchase Details
Closed on
Jul 6, 2018
Sold by
Lara Jose Gutierrez and Gutierrez Maria Y Flores De
Bought by
Parkway Bank And Trust Company and Trust Number 15860
Current Estimated Value
Purchase Details
Closed on
Nov 17, 2017
Sold by
Federal Home Loan Mortgage Corporation
Bought by
Delara Jose Gutierrez and Gutierrez Maria Yolanda Flores
Purchase Details
Closed on
Apr 14, 2017
Sold by
Palm Bryan
Bought by
Federal Home Loan Mortgage Corporation
Purchase Details
Closed on
Feb 11, 2005
Sold by
Seneca Investments Corp
Bought by
Palm Bryan
Home Financials for this Owner
Home Financials are based on the most recent Mortgage that was taken out on this home.
Original Mortgage
$104,000
Interest Rate
7.54%
Mortgage Type
Purchase Money Mortgage
Create a Home Valuation Report for This Property
The Home Valuation Report is an in-depth analysis detailing your home's value as well as a comparison with similar homes in the area
Home Values in the Area
Average Home Value in this Area
Purchase History
| Date | Buyer | Sale Price | Title Company |
|---|---|---|---|
| Parkway Bank And Trust Company | -- | None Available | |
| Delara Jose Gutierrez | $82,000 | Attorney | |
| Federal Home Loan Mortgage Corporation | -- | Premier Title | |
| Palm Bryan | $130,000 | Stewart Title Of Illinois |
Source: Public Records
Mortgage History
| Date | Status | Borrower | Loan Amount |
|---|---|---|---|
| Previous Owner | Palm Bryan | $104,000 | |
| Closed | Palm Bryan | $26,000 |
Source: Public Records
Tax History Compared to Growth
Tax History
| Year | Tax Paid | Tax Assessment Tax Assessment Total Assessment is a certain percentage of the fair market value that is determined by local assessors to be the total taxable value of land and additions on the property. | Land | Improvement |
|---|---|---|---|---|
| 2024 | $1,062 | $12,110 | $1,998 | $10,112 |
| 2023 | $996 | $11,000 | $1,611 | $9,389 |
| 2022 | $996 | $11,000 | $1,611 | $9,389 |
| 2021 | $1,006 | $10,999 | $1,611 | $9,388 |
| 2020 | $954 | $7,384 | $934 | $6,450 |
| 2019 | $957 | $8,192 | $934 | $7,258 |
| 2018 | $1,025 | $8,623 | $934 | $7,689 |
| 2017 | $2,149 | $9,984 | $837 | $9,147 |
| 2016 | $2,000 | $9,984 | $837 | $9,147 |
| 2015 | $1,830 | $9,984 | $837 | $9,147 |
| 2014 | $1,931 | $10,410 | $773 | $9,637 |
| 2013 | $1,893 | $10,410 | $773 | $9,637 |
Source: Public Records
Map
Nearby Homes
- 4976 N Milwaukee Ave Unit 101
- 4926 N Lester Ave Unit 49261W
- 4915 N Central Ave Unit 16-3E
- 5342 W Winnemac Ave
- 4956 N Lockwood Ave Unit 1
- 4946 N Lockwood Ave Unit 1N
- 5646 W Grover St
- 5501 W Lawrence Ave Unit 3C
- 5447 W Lawrence Ave Unit 301
- 5677 W Higgins Ave
- 5705 W Higgins Ave
- 5641 W Carmen Ave
- 5741 W Lawrence Ave Unit 2
- 5134 W Strong St
- 5710 W Leland Ave
- 5151 W Winona St
- 5431 W Wilson Ave
- 5516 W Windsor Ave Unit 2M
- 5416 W Windsor Ave Unit 1N
- 5330 W Windsor Ave Unit 3I
- 5501 W Edmunds St Unit GARDEN
- 5501 W Edmunds St Unit 2D
- 5501 W Edmunds St Unit GD
- 5501 W Edmunds St Unit GB
- 5501 W Edmunds St Unit GA
- 5501 W Edmunds St Unit 2C
- 5457 W Edmunds St Unit 1B
- 5503 W Edmunds St Unit 2E
- 5503 W Edmunds St Unit 2B
- 5457 W Edmunds St Unit 2A
- 5503 W Edmunds St Unit 1B
- 5503 W Edmunds St Unit 2C
- 5503 W Edmunds St Unit 1F
- 5503 W Edmunds St Unit 2F
- 5503 W Edmunds St Unit 1E
- 5503 W Edmunds St Unit 1D
- 5503 W Edmunds St Unit 1C
- 5503 W Edmunds St Unit 1A
- 5457 W Edmunds St Unit 2B
- 5503 W Edmunds St Unit GD