5503 Nanday Ct Unit 3 Oceanside, CA 92057
North Valley NeighborhoodEstimated Value: $1,080,013 - $1,177,000
5
Beds
3
Baths
2,873
Sq Ft
$393/Sq Ft
Est. Value
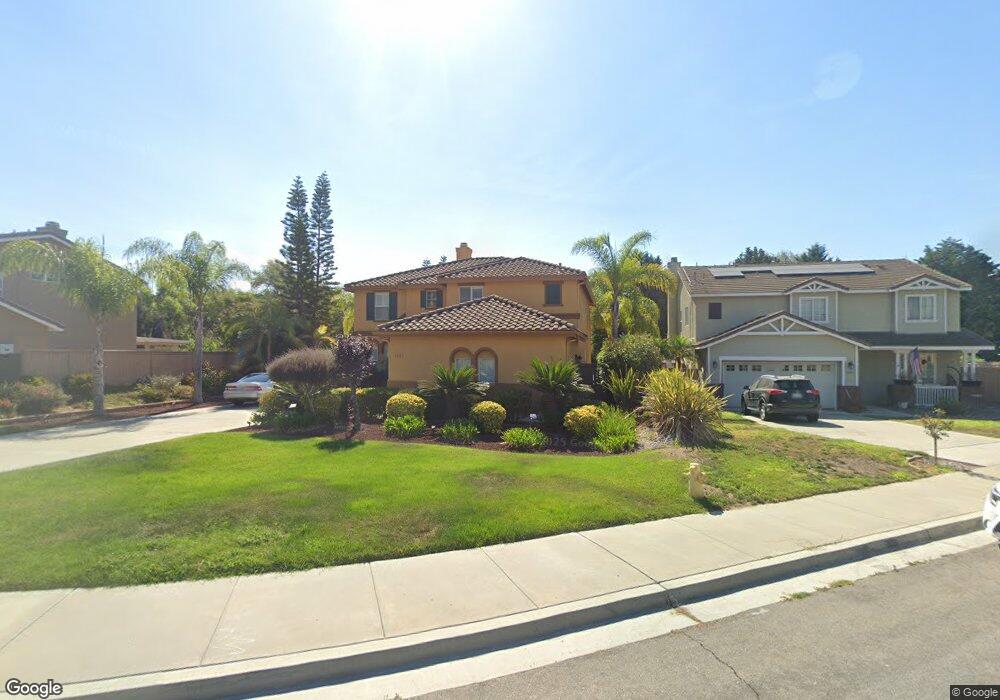
About This Home
This home is located at 5503 Nanday Ct Unit 3, Oceanside, CA 92057 and is currently estimated at $1,129,253, approximately $393 per square foot. 5503 Nanday Ct Unit 3 is a home located in San Diego County with nearby schools including Bonsall West Elementary School, Sullivan Middle School, and Bonsall High.
Ownership History
Date
Name
Owned For
Owner Type
Purchase Details
Closed on
Nov 18, 2002
Sold by
Kb Home Coastal Inc
Bought by
Tran Phong T and Nguyen Tukhanh T
Current Estimated Value
Home Financials for this Owner
Home Financials are based on the most recent Mortgage that was taken out on this home.
Original Mortgage
$250,000
Outstanding Balance
$103,480
Interest Rate
5.86%
Estimated Equity
$1,025,773
Create a Home Valuation Report for This Property
The Home Valuation Report is an in-depth analysis detailing your home's value as well as a comparison with similar homes in the area
Home Values in the Area
Average Home Value in this Area
Purchase History
| Date | Buyer | Sale Price | Title Company |
|---|---|---|---|
| Tran Phong T | $413,500 | First American Title |
Source: Public Records
Mortgage History
| Date | Status | Borrower | Loan Amount |
|---|---|---|---|
| Open | Tran Phong T | $250,000 |
Source: Public Records
Tax History
| Year | Tax Paid | Tax Assessment Tax Assessment Total Assessment is a certain percentage of the fair market value that is determined by local assessors to be the total taxable value of land and additions on the property. | Land | Improvement |
|---|---|---|---|---|
| 2025 | $6,221 | $604,660 | $260,690 | $343,970 |
| 2024 | $6,221 | $592,805 | $255,579 | $337,226 |
| 2023 | $6,083 | $581,182 | $250,568 | $330,614 |
| 2022 | $5,975 | $569,787 | $245,655 | $324,132 |
| 2021 | $5,866 | $558,616 | $240,839 | $317,777 |
| 2020 | $5,818 | $552,889 | $238,370 | $314,519 |
| 2019 | $5,707 | $542,049 | $233,697 | $308,352 |
| 2018 | $5,735 | $531,421 | $229,115 | $302,306 |
| 2017 | $5,620 | $521,002 | $224,623 | $296,379 |
| 2016 | $5,487 | $510,787 | $220,219 | $290,568 |
| 2015 | $5,401 | $503,116 | $216,912 | $286,204 |
| 2014 | $4,828 | $450,000 | $177,000 | $273,000 |
Source: Public Records
Map
Nearby Homes
- 5450 Alexandrine Ct
- 1120 Championship Rd
- 0 Wilshire Rd
- 1241 Breakaway Dr
- 1061 Boulder Place
- 1113 Teal Way
- 1039 Eliot St
- 1486 Puritan Way
- 1247 Bellingham Dr
- 1438 Salem Ct
- 1479 Puritan Dr
- 5168 Indian Ct
- 5164 Indian Ct
- 5116 Weymouth Way
- 868 Panella Ct
- 290 Hadley Way
- 280 Paxton Way
- 278 Paxton Way
- 671 Parker St
- 276 Paxton Way
- 5507 Nanday Ct
- 5499 Nanday Ct
- 5511 Nanday Ct
- 5495 Nanday Ct
- 5498 Nanday Ct
- 5502 Nanday Ct
- 5515 Nanday Ct
- 5499 Parrolette Ct
- 5494 Nanday Ct Unit 3
- 5506 Nanday Ct
- 5519 Nanday Ct
- 5495 Parrolette Ct
- 5490 Parrolette Ct
- 5510 Nanday Ct Unit 3
- 5523 Nanday Ct
- 5491 Parrolette Ct
- 5486 Parrolette Ct
- 5514 Nanday Ct
- 5487 Parrolette Ct
- 5527 Nanday Ct
Your Personal Tour Guide
Ask me questions while you tour the home.