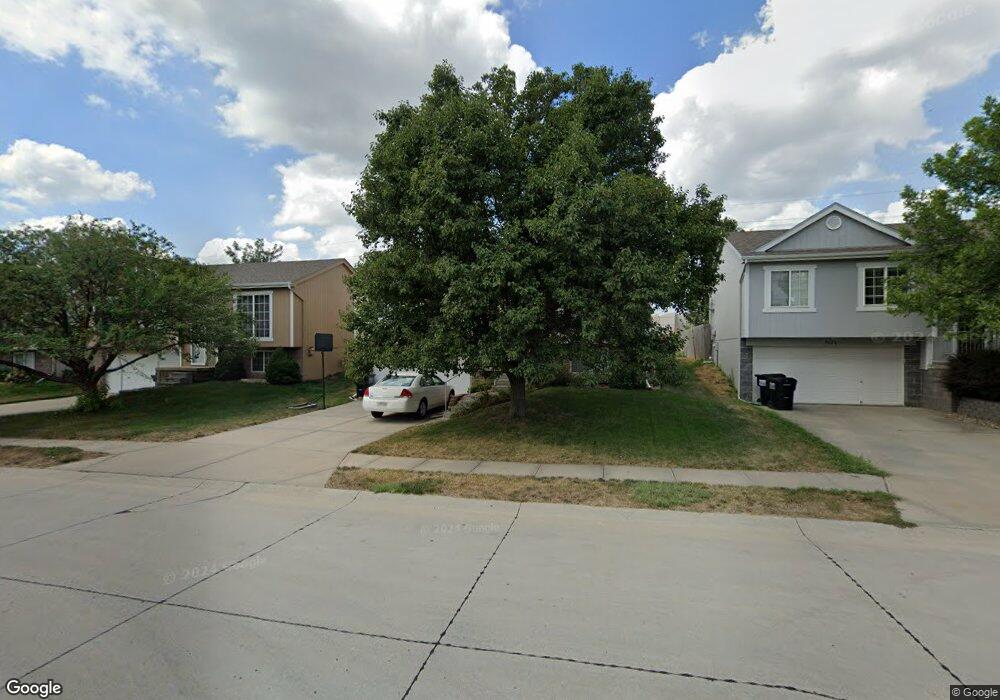
5504 S 191st Ave Omaha, NE 68135
Southwest Omaha NeighborhoodEstimated Value: $262,605 - $291,000
3
Beds
2
Baths
1,041
Sq Ft
$265/Sq Ft
Est. Value
About This Home
This home is located at 5504 S 191st Ave, Omaha, NE 68135 and is currently estimated at $276,151, approximately $265 per square foot. 5504 S 191st Ave is a home located in Douglas County with nearby schools including Reeder Elementary School, Beadle Middle School, and Millard West High School.
Ownership History
Date
Name
Owned For
Owner Type
Purchase Details
Closed on
Jul 22, 2002
Sold by
Celebrity Homes Inc
Bought by
Marx Cindy M
Current Estimated Value
Home Financials for this Owner
Home Financials are based on the most recent Mortgage that was taken out on this home.
Original Mortgage
$114,306
Outstanding Balance
$47,665
Interest Rate
6.48%
Mortgage Type
FHA
Estimated Equity
$228,486
Create a Home Valuation Report for This Property
The Home Valuation Report is an in-depth analysis detailing your home's value as well as a comparison with similar homes in the area
Home Values in the Area
Average Home Value in this Area
Purchase History
| Date | Buyer | Sale Price | Title Company |
|---|---|---|---|
| Marx Cindy M | $116,000 | -- |
Source: Public Records
Mortgage History
| Date | Status | Borrower | Loan Amount |
|---|---|---|---|
| Open | Marx Cindy M | $114,306 |
Source: Public Records
Tax History Compared to Growth
Tax History
| Year | Tax Paid | Tax Assessment Tax Assessment Total Assessment is a certain percentage of the fair market value that is determined by local assessors to be the total taxable value of land and additions on the property. | Land | Improvement |
|---|---|---|---|---|
| 2025 | $3,580 | $236,100 | $24,000 | $212,100 |
| 2024 | $4,301 | $210,100 | $24,000 | $186,100 |
| 2023 | $4,301 | $210,100 | $24,000 | $186,100 |
| 2022 | $3,859 | $173,000 | $24,000 | $149,000 |
| 2021 | $3,875 | $173,000 | $24,000 | $149,000 |
| 2020 | $3,616 | $153,200 | $24,000 | $129,200 |
| 2019 | $3,607 | $153,200 | $24,000 | $129,200 |
| 2018 | $3,568 | $143,300 | $24,000 | $119,300 |
| 2017 | $3,221 | $131,300 | $24,000 | $107,300 |
| 2016 | $2,962 | $119,700 | $12,600 | $107,100 |
| 2015 | $3,049 | $119,700 | $12,600 | $107,100 |
| 2014 | $3,049 | $119,700 | $12,600 | $107,100 |
Source: Public Records
Map
Nearby Homes