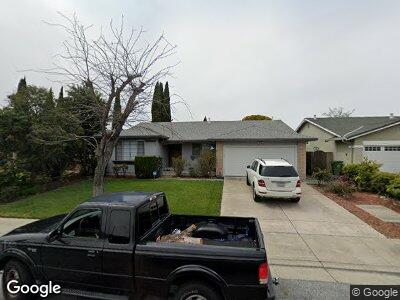
5507 Shadowcrest Way San Jose, CA 95123
Playa Del Rey NeighborhoodEstimated Value: $1,452,000 - $1,650,225
3
Beds
2
Baths
1,745
Sq Ft
$889/Sq Ft
Est. Value
About This Home
This home is located at 5507 Shadowcrest Way, San Jose, CA 95123 and is currently estimated at $1,551,056, approximately $888 per square foot. 5507 Shadowcrest Way is a home located in Santa Clara County with nearby schools including Frost (Earl) Elementary School, Herman (Leonard) Intermediate School, and Santa Teresa High School.
Ownership History
Date
Name
Owned For
Owner Type
Purchase Details
Closed on
Oct 25, 2006
Sold by
Briggs Kirk S
Bought by
Engdasew Zufan
Current Estimated Value
Home Financials for this Owner
Home Financials are based on the most recent Mortgage that was taken out on this home.
Original Mortgage
$66,000
Outstanding Balance
$39,993
Interest Rate
6.28%
Mortgage Type
Credit Line Revolving
Estimated Equity
$1,511,063
Purchase Details
Closed on
Mar 4, 1999
Sold by
Wang Sang Y and Wang Helen C
Bought by
Briggs Kirk S
Home Financials for this Owner
Home Financials are based on the most recent Mortgage that was taken out on this home.
Original Mortgage
$213,500
Interest Rate
7.25%
Purchase Details
Closed on
Dec 15, 1994
Sold by
Wang Sang Yen and Wang Helen
Bought by
Wang Sang Yen and Wang Helen C
Create a Home Valuation Report for This Property
The Home Valuation Report is an in-depth analysis detailing your home's value as well as a comparison with similar homes in the area
Home Values in the Area
Average Home Value in this Area
Purchase History
| Date | Buyer | Sale Price | Title Company |
|---|---|---|---|
| Engdasew Zufan | $670,000 | Stewart Title Of Ca Inc | |
| Briggs Kirk S | $305,000 | First American Title Guarant | |
| Wang Sang Yen | -- | -- |
Source: Public Records
Mortgage History
| Date | Status | Borrower | Loan Amount |
|---|---|---|---|
| Open | Engdasew Zufan | $66,000 | |
| Open | Engdasew Zufan | $536,000 | |
| Previous Owner | Briggs Kirk S | $209,000 | |
| Previous Owner | Briggs Kirk S | $209,000 | |
| Previous Owner | Briggs Kirk S | $213,500 |
Source: Public Records
Tax History Compared to Growth
Tax History
| Year | Tax Paid | Tax Assessment Tax Assessment Total Assessment is a certain percentage of the fair market value that is determined by local assessors to be the total taxable value of land and additions on the property. | Land | Improvement |
|---|---|---|---|---|
| 2024 | $12,474 | $880,041 | $616,034 | $264,007 |
| 2023 | $12,284 | $862,786 | $603,955 | $258,831 |
| 2022 | $12,197 | $845,869 | $592,113 | $253,756 |
| 2021 | $12,021 | $829,284 | $580,503 | $248,781 |
| 2020 | $11,765 | $820,782 | $574,551 | $246,231 |
| 2019 | $11,492 | $804,689 | $563,286 | $241,403 |
| 2018 | $11,414 | $788,912 | $552,242 | $236,670 |
| 2017 | $11,263 | $773,444 | $541,414 | $232,030 |
| 2016 | $10,720 | $758,280 | $530,799 | $227,481 |
| 2015 | $10,477 | $746,891 | $522,826 | $224,065 |
| 2014 | $9,002 | $683,000 | $478,100 | $204,900 |
Source: Public Records
Map
Nearby Homes
- 5501 Shadowcrest Way
- 569 Blairburry Way
- 5699 Saxony Ct
- 5490 Don Diego Ct
- 410 Colony Cove Dr
- 5465 Don Edmondo Ct
- 5571 Sunny Oaks Dr
- 5446 Colony Field Dr
- 447 Colony Knoll Dr
- 5426 Colony Green Dr
- 441 Colony Knoll Dr
- 405 Colony Knoll Dr
- 763 Delaware Ave Unit 4
- 5404 Colony Park Cir
- 5731 Indian Ave
- 717 Bolivar Dr
- 653 Navajo Ct
- 5630 New Ct
- 771 Delaware Ave Unit 3
- 676 Bolivar Dr
- 5507 Shadowcrest Way
- 5531 Shadowcrest Way
- 5534 Southcrest Way
- 5540 Southcrest Way
- 5495 Shadowcrest Way
- 5549 Shadowcrest Way
- 5528 Southcrest Way
- 5508 Maplecrest Ct
- 5546 Southcrest Way
- 5522 Southcrest Way
- 5555 Shadowcrest Way
- 5489 Shadowcrest Way
- 5496 Shadowcrest Way
- 5550 Maplecrest Ct
- 5552 Southcrest Way
- 5514 Maplecrest Ct
- 5516 Southcrest Way
- 5483 Shadowcrest Way
- 5561 Shadowcrest Way
- 5533 Southcrest Way