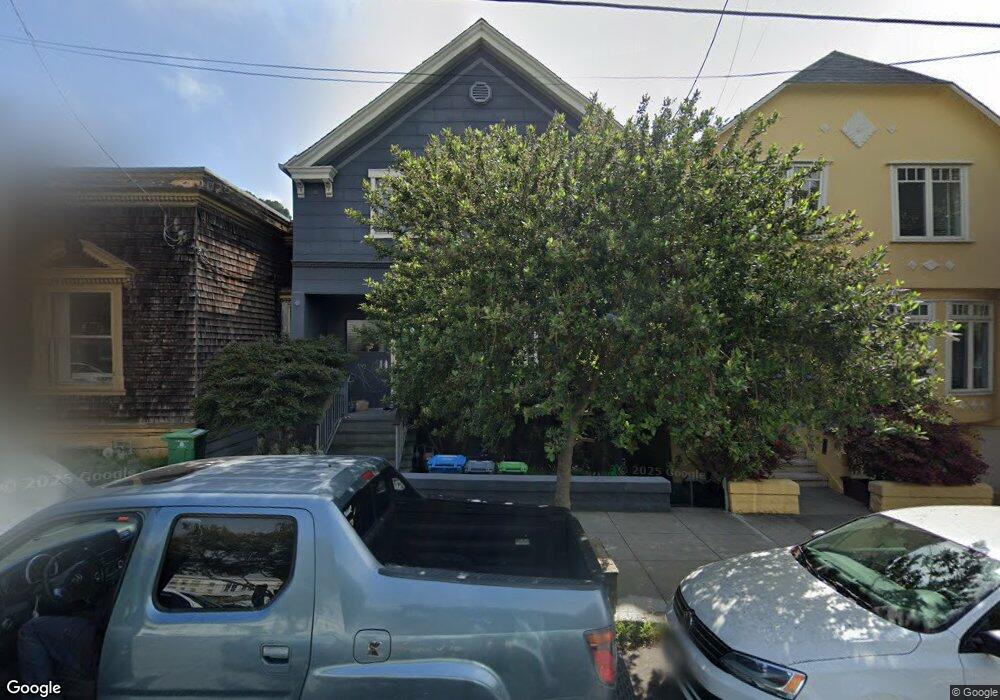
551 Eureka St San Francisco, CA 94114
Noe Valley NeighborhoodEstimated Value: $3,029,000 - $4,322,000
4
Beds
3
Baths
2,595
Sq Ft
$1,398/Sq Ft
Est. Value
About This Home
This home is located at 551 Eureka St, San Francisco, CA 94114 and is currently estimated at $3,627,634, approximately $1,397 per square foot. 551 Eureka St is a home located in San Francisco County with nearby schools including Alvarado Elementary, James Lick Middle School, and Thomas Edison Charter Academy.
Ownership History
Date
Name
Owned For
Owner Type
Purchase Details
Closed on
Aug 4, 2021
Sold by
Hooker Matthew W and Schrader Allyson Maria
Bought by
Hooker Matthew W and Schrader Allyson Maria
Current Estimated Value
Home Financials for this Owner
Home Financials are based on the most recent Mortgage that was taken out on this home.
Original Mortgage
$2,246,680
Outstanding Balance
$2,042,928
Interest Rate
2.9%
Mortgage Type
New Conventional
Estimated Equity
$1,584,706
Purchase Details
Closed on
Feb 16, 2021
Sold by
Schrader Allyson and Schrader Matthew
Bought by
Hooker Matthew W and Schrader Allyson Maria
Purchase Details
Closed on
Aug 30, 2020
Sold by
Hupp Adam Stevens and Hupp Erin E
Bought by
Schrader Allyson and Hooker Matthew
Home Financials for this Owner
Home Financials are based on the most recent Mortgage that was taken out on this home.
Original Mortgage
$2,275,000
Interest Rate
3.62%
Mortgage Type
New Conventional
Purchase Details
Closed on
Aug 13, 2014
Sold by
Banta John H and Banta Leslie A
Bought by
Hupp Family Trust and Burg Hupp Erin E
Create a Home Valuation Report for This Property
The Home Valuation Report is an in-depth analysis detailing your home's value as well as a comparison with similar homes in the area
Home Values in the Area
Average Home Value in this Area
Purchase History
| Date | Buyer | Sale Price | Title Company |
|---|---|---|---|
| Hooker Matthew W | -- | Chicago Title Company | |
| Hooker Matthew W | -- | None Available | |
| Schrader Allyson | $3,250,000 | Chicago Title Company | |
| Hupp Family Trust | $1,800,000 | Chicago Title Company |
Source: Public Records
Mortgage History
| Date | Status | Borrower | Loan Amount |
|---|---|---|---|
| Open | Hooker Matthew W | $2,246,680 | |
| Closed | Schrader Allyson | $2,275,000 |
Source: Public Records
Tax History
| Year | Tax Paid | Tax Assessment Tax Assessment Total Assessment is a certain percentage of the fair market value that is determined by local assessors to be the total taxable value of land and additions on the property. | Land | Improvement |
|---|---|---|---|---|
| 2025 | $41,109 | $3,517,902 | $2,462,532 | $1,055,370 |
| 2024 | $41,109 | $3,448,925 | $2,414,248 | $1,034,677 |
| 2023 | $40,505 | $3,381,300 | $2,366,910 | $1,014,390 |
| 2022 | $39,758 | $3,315,000 | $2,320,500 | $994,500 |
| 2021 | $39,062 | $3,250,000 | $2,275,000 | $975,000 |
| 2020 | $26,767 | $2,167,510 | $1,384,661 | $782,849 |
| 2019 | $25,798 | $2,125,011 | $1,357,511 | $767,500 |
| 2018 | $24,928 | $2,083,346 | $1,330,894 | $752,452 |
| 2017 | $22,244 | $1,863,998 | $1,304,799 | $559,199 |
| 2016 | $21,901 | $1,827,450 | $1,279,215 | $548,235 |
| 2015 | $21,632 | $1,800,000 | $1,260,000 | $540,000 |
| 2014 | $3,315 | $253,493 | $135,197 | $118,296 |
Source: Public Records
Map
Nearby Homes
- 470 Collingwood St Unit 2
- 4333 23rd St
- 510 Jersey St
- 1 Hoffman Ave Unit A
- 200-202 Hoffman Ave
- 200 Hoffman Ave
- 543 Jersey St
- 268 Grand View Ave
- 130 Grand View Ave
- 3711 Market St Unit TOP
- 3711 Market St Unit 3
- 335 Diamond St
- 728 Castro St Unit 728
- 1060 Noe St Unit 1064A
- 1060 Noe St Unit 1060A
- 1060 Noe St Unit 1060
- 1060 Noe St Unit 1062A
- 282 Eureka St
- 1116 Diamond St
- 647 Grand View Ave Unit 4
- 555 Eureka St
- 545 Eureka St
- 561 Eureka St
- 541 Eureka St
- 565 Eureka St
- 535 Eureka St
- 531 Eureka St Unit 533
- 571-573 Eureka St
- 571 Eureka St Unit 573
- 548 Diamond St
- 554 Diamond St
- 525 Eureka St Unit 527
- 542 Diamond St
- 558 Diamond St
- 577 Eureka St
- 575 Eureka St Unit 575
- 564 Diamond St
- 534 Diamond St Unit 536
- 552 Diamond St
- 570 Diamond St
Your Personal Tour Guide
Ask me questions while you tour the home.