Estimated Value: $137,000 - $180,000
3
Beds
2
Baths
1,604
Sq Ft
$99/Sq Ft
Est. Value
About This Home
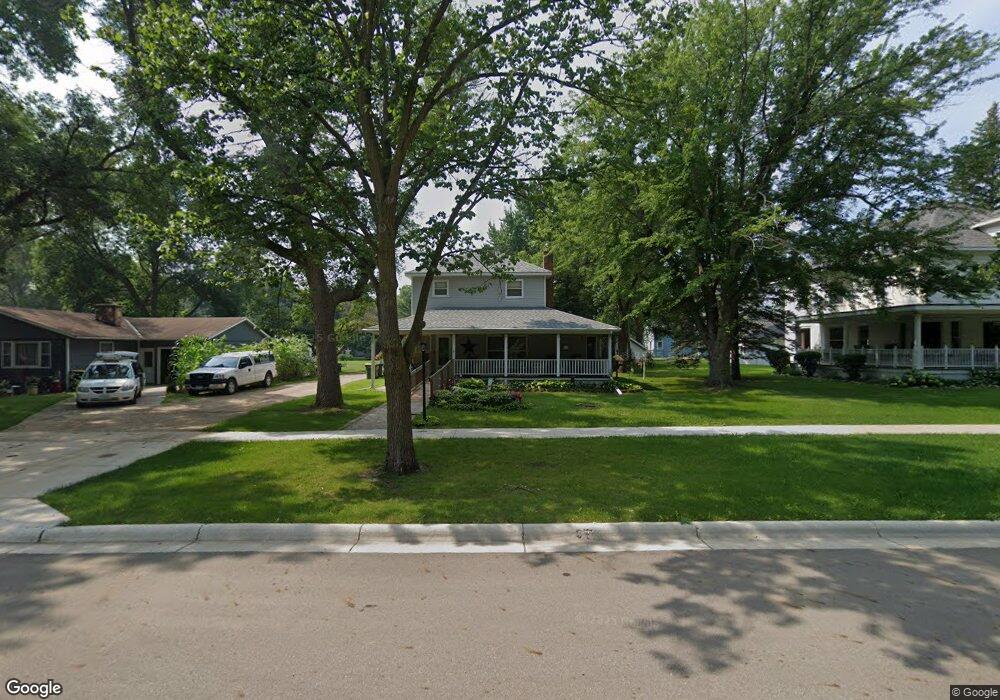
This home is located at 551 Rowland St, Tracy, MN 56175 and is currently estimated at $159,012, approximately $99 per square foot. 551 Rowland St is a home located in Lyon County with nearby schools including Tracy Elementary School, Tracy Secondary School, and St. Mary's Catholic School.
Ownership History
Date
Name
Owned For
Owner Type
Purchase Details
Closed on
Sep 30, 2025
Sold by
Gyongyose Family Trust and Jackson Robert Justin
Bought by
Moore Matthew and Moore Brianda
Current Estimated Value
Home Financials for this Owner
Home Financials are based on the most recent Mortgage that was taken out on this home.
Original Mortgage
$243,793
Outstanding Balance
$243,793
Interest Rate
6.58%
Mortgage Type
FHA
Estimated Equity
-$84,781
Purchase Details
Closed on
Mar 2, 2022
Sold by
Peterson Arthur L
Bought by
Huerta Mayra and Sifuentes Joseph M
Purchase Details
Closed on
Feb 22, 2022
Sold by
Peterson Arthur
Bought by
Huerta Mayra and Sifuentes Joseph
Create a Home Valuation Report for This Property
The Home Valuation Report is an in-depth analysis detailing your home's value as well as a comparison with similar homes in the area
Home Values in the Area
Average Home Value in this Area
Purchase History
| Date | Buyer | Sale Price | Title Company |
|---|---|---|---|
| Moore Matthew | $249,500 | Title And Abstract Services | |
| Huerta Mayra | -- | -- | |
| Huerta Mayra | -- | -- | |
| Huerta Mayra | $150,000 | -- |
Source: Public Records
Mortgage History
| Date | Status | Borrower | Loan Amount |
|---|---|---|---|
| Open | Moore Matthew | $243,793 |
Source: Public Records
Tax History Compared to Growth
Tax History
| Year | Tax Paid | Tax Assessment Tax Assessment Total Assessment is a certain percentage of the fair market value that is determined by local assessors to be the total taxable value of land and additions on the property. | Land | Improvement |
|---|---|---|---|---|
| 2025 | $2,594 | $140,000 | $5,700 | $134,300 |
| 2024 | $2,776 | $132,800 | $5,700 | $127,100 |
| 2023 | $1,708 | $118,500 | $5,300 | $113,200 |
| 2022 | $1,304 | $98,000 | $5,300 | $92,700 |
| 2021 | $1,298 | $77,800 | $5,300 | $72,500 |
| 2020 | $1,282 | $77,900 | $5,300 | $72,600 |
| 2019 | $1,256 | $77,900 | $5,300 | $72,600 |
| 2018 | $1,246 | $78,300 | $5,300 | $73,000 |
| 2017 | $1,246 | $78,300 | $5,300 | $73,000 |
| 2016 | $1,212 | $0 | $0 | $0 |
| 2015 | -- | $0 | $0 | $0 |
| 2014 | -- | $0 | $0 | $0 |
Source: Public Records
Map
Nearby Homes