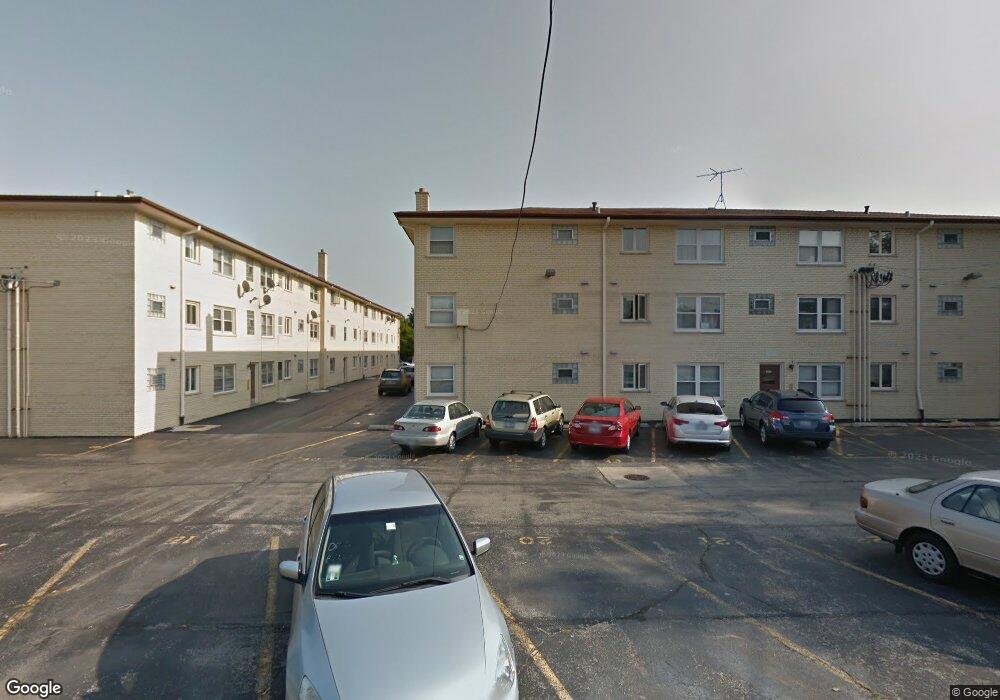
5510 W Windsor Ave Unit 3G Chicago, IL 60630
Jefferson Park NeighborhoodEstimated Value: $225,068 - $243,000
2
Beds
2
Baths
1,100
Sq Ft
$212/Sq Ft
Est. Value
About This Home
This home is located at 5510 W Windsor Ave Unit 3G, Chicago, IL 60630 and is currently estimated at $233,517, approximately $212 per square foot. 5510 W Windsor Ave Unit 3G is a home located in Cook County with nearby schools including Prussing Elementary School, William Howard Taft High School, and St John Lutheran School.
Ownership History
Date
Name
Owned For
Owner Type
Purchase Details
Closed on
Oct 16, 2009
Sold by
Conneen Mary T
Bought by
Hughes Timothy
Current Estimated Value
Home Financials for this Owner
Home Financials are based on the most recent Mortgage that was taken out on this home.
Original Mortgage
$160,225
Interest Rate
5.11%
Mortgage Type
New Conventional
Purchase Details
Closed on
Jan 31, 2005
Sold by
Markevych Volodymyr and Markevych Jozefa
Bought by
Conneen Mary T
Home Financials for this Owner
Home Financials are based on the most recent Mortgage that was taken out on this home.
Original Mortgage
$200,000
Interest Rate
5.12%
Mortgage Type
Purchase Money Mortgage
Purchase Details
Closed on
Sep 30, 2002
Sold by
Cutaia Margaret Happs and Happs Margaret
Bought by
Markevych Volodymyr and Markevych Jozefa
Home Financials for this Owner
Home Financials are based on the most recent Mortgage that was taken out on this home.
Original Mortgage
$120,000
Interest Rate
6.29%
Create a Home Valuation Report for This Property
The Home Valuation Report is an in-depth analysis detailing your home's value as well as a comparison with similar homes in the area
Home Values in the Area
Average Home Value in this Area
Purchase History
| Date | Buyer | Sale Price | Title Company |
|---|---|---|---|
| Hughes Timothy | $188,500 | Cti | |
| Conneen Mary T | $224,500 | -- | |
| Markevych Volodymyr | $150,000 | Ticor Title Insurance |
Source: Public Records
Mortgage History
| Date | Status | Borrower | Loan Amount |
|---|---|---|---|
| Previous Owner | Hughes Timothy | $160,225 | |
| Previous Owner | Conneen Mary T | $200,000 | |
| Previous Owner | Markevych Volodymyr | $120,000 |
Source: Public Records
Tax History Compared to Growth
Tax History
| Year | Tax Paid | Tax Assessment Tax Assessment Total Assessment is a certain percentage of the fair market value that is determined by local assessors to be the total taxable value of land and additions on the property. | Land | Improvement |
|---|---|---|---|---|
| 2024 | $2,543 | $18,641 | $3,678 | $14,963 |
| 2023 | $2,457 | $15,360 | $2,942 | $12,418 |
| 2022 | $2,457 | $15,360 | $2,942 | $12,418 |
| 2021 | $2,420 | $15,359 | $2,942 | $12,417 |
| 2020 | $1,943 | $11,818 | $1,523 | $10,295 |
| 2019 | $1,964 | $13,201 | $1,523 | $11,678 |
| 2018 | $1,930 | $13,201 | $1,523 | $11,678 |
| 2017 | $1,712 | $11,324 | $1,366 | $9,958 |
| 2016 | $1,769 | $11,324 | $1,366 | $9,958 |
| 2015 | $1,595 | $11,324 | $1,366 | $9,958 |
| 2014 | $1,517 | $10,738 | $1,261 | $9,477 |
| 2013 | $1,682 | $11,870 | $1,261 | $10,609 |
Source: Public Records
Map
Nearby Homes
- 5516 W Windsor Ave Unit 2M
- 5416 W Windsor Ave Unit 1N
- 5448 W Agatite Ave
- 5352 W Sunnyside Ave
- 5330 W Windsor Ave Unit 3I
- 5501 W Lawrence Ave Unit 3C
- 5447 W Lawrence Ave Unit 301
- 5354 W Montrose Ave
- 5401 W Montrose Ave
- 5710 W Leland Ave
- 5738 W Windsor Ave
- 5704 W Montrose Ave Unit 2B
- 5741 W Lawrence Ave Unit 2
- 5410 W Hutchinson St
- 4915 N Central Ave Unit 16-3E
- 5221 W Montrose Ave
- 4926 N Lester Ave Unit 49261W
- 4414 N Monitor Ave
- 5844 W Leland Ave
- 4656 N Leamington Ave
- 5512 W Windsor Ave Unit 2J
- 5512 W Windsor Ave Unit 1I
- 5512 W Windsor Ave Unit 2I
- 5512 W Windsor Ave Unit 3J
- 5512 W Windsor Ave Unit 3I
- 5512 W Windsor Ave Unit 1J
- 5510 W Windsor Ave Unit 1H
- 5510 W Windsor Ave Unit 3H
- 5510 W Windsor Ave Unit 1G
- 5510 W Windsor Ave Unit 2G
- 5510 W Windsor Ave Unit 2H
- 5514 W Windsor Ave Unit 2K
- 5514 W Windsor Ave Unit 3K
- 5514 W Windsor Ave Unit 2L
- 5514 W Windsor Ave Unit 1K
- 5514 W Windsor Ave Unit 3L
- 5514 W Windsor Ave Unit 1L
- 5516 W Windsor Ave Unit 3N
- 5516 W Windsor Ave Unit 3M
- 5516 W Windsor Ave Unit 2N