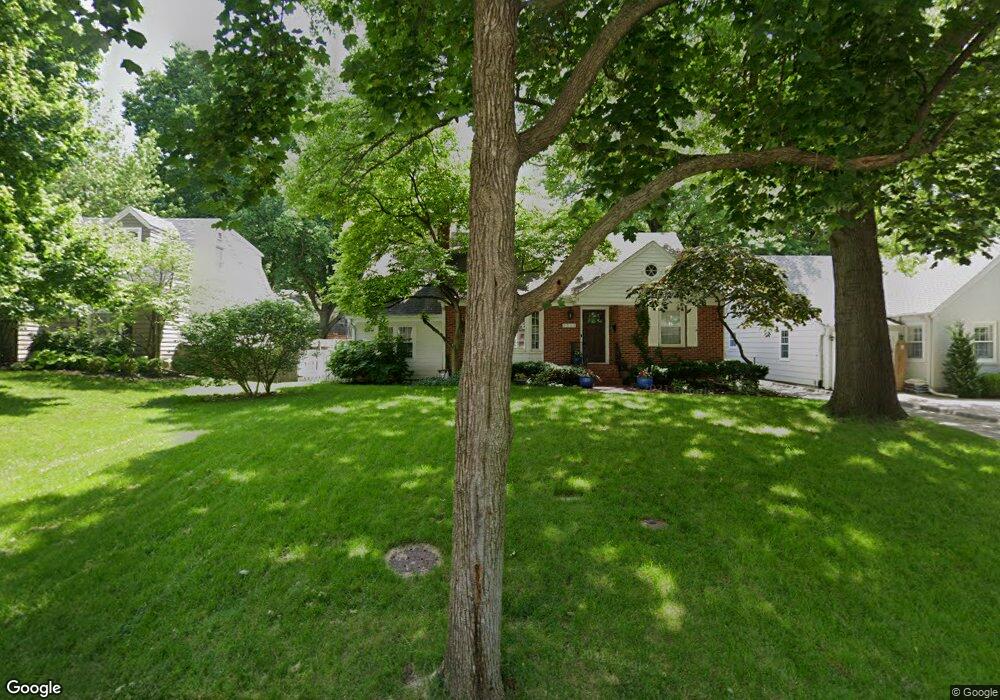
5511 Chadwick Rd Fairway, KS 66205
Estimated Value: $668,000 - $1,013,000
5
Beds
3
Baths
3,423
Sq Ft
$251/Sq Ft
Est. Value
About This Home
This home is located at 5511 Chadwick Rd, Fairway, KS 66205 and is currently estimated at $857,939, approximately $250 per square foot. 5511 Chadwick Rd is a home located in Johnson County with nearby schools including Westwood View Elementary School, Indian Hills Middle School, and Shawnee Mission East High School.
Ownership History
Date
Name
Owned For
Owner Type
Purchase Details
Closed on
Nov 30, 2005
Sold by
Worthington Roy H and Worthington Nancy E
Bought by
Worthington Scott A and Worthington Maria A
Current Estimated Value
Purchase Details
Closed on
Dec 5, 2002
Sold by
Cook Timothy P and Cook Sally Hunter Gibbs
Bought by
Worthington Roy H and Worthington Nancy E
Home Financials for this Owner
Home Financials are based on the most recent Mortgage that was taken out on this home.
Original Mortgage
$150,000
Outstanding Balance
$59,221
Interest Rate
5.12%
Estimated Equity
$798,718
Create a Home Valuation Report for This Property
The Home Valuation Report is an in-depth analysis detailing your home's value as well as a comparison with similar homes in the area
Home Values in the Area
Average Home Value in this Area
Purchase History
| Date | Buyer | Sale Price | Title Company |
|---|---|---|---|
| Worthington Scott A | -- | None Available | |
| Worthington Roy H | -- | Chicago Title Insurance Co |
Source: Public Records
Mortgage History
| Date | Status | Borrower | Loan Amount |
|---|---|---|---|
| Open | Worthington Roy H | $150,000 |
Source: Public Records
Tax History Compared to Growth
Tax History
| Year | Tax Paid | Tax Assessment Tax Assessment Total Assessment is a certain percentage of the fair market value that is determined by local assessors to be the total taxable value of land and additions on the property. | Land | Improvement |
|---|---|---|---|---|
| 2024 | $9,658 | $81,615 | $26,803 | $54,812 |
| 2023 | $8,634 | $72,289 | $26,803 | $45,486 |
| 2022 | $7,586 | $64,319 | $26,803 | $37,516 |
| 2021 | $7,645 | $62,272 | $20,616 | $41,656 |
| 2020 | $7,725 | $62,227 | $18,737 | $43,490 |
| 2019 | $7,636 | $61,272 | $18,737 | $42,535 |
| 2018 | $7,646 | $61,134 | $18,737 | $42,397 |
| 2017 | $7,486 | $58,926 | $18,737 | $40,189 |
| 2016 | $7,253 | $56,615 | $18,737 | $37,878 |
| 2015 | $6,734 | $53,395 | $18,737 | $34,658 |
| 2013 | -- | $51,716 | $15,777 | $35,939 |
Source: Public Records
Map
Nearby Homes
- 5535 Canterbury Rd
- 5401 Windsor Ln
- 5439 Norwood St
- 5525 Norwood Rd
- 5324 Fairway Rd
- 5531 Norwood Rd
- 5500 Mission Rd
- 5443 Pawnee Ln
- 5245 Reinhardt Dr
- 5419 Mohawk Ln
- 5750 Windsor Dr
- 2816 W 51st Terrace
- 5335 Mission Woods Rd
- 2614 W 51st Terrace
- 2524 W 51st Terrace
- 5332 Neosho Ln
- 2710 W 50th Terrace
- 5943 Sunrise Dr
- 6010 Reinhardt Dr
- 2211 W 51st St
- 5507 Chadwick Rd
- 5519 Chadwick Rd
- 5501 Chadwick St
- 5501 Chadwick Rd
- 5523 Chadwick Rd
- 5512 Aberdeen Rd
- 5506 Aberdeen Rd
- 5518 Aberdeen Rd
- 5500 Aberdeen Rd
- 5445 Chadwick Rd
- 5510 Chadwick Rd
- 5529 Chadwick Rd
- 5506 Chadwick Rd
- 5522 Aberdeen Rd
- 5500 Chadwick Rd
- 5520 Chadwick Rd
- 5441 Chadwick Rd
- 5531 Chadwick Rd
- 5452 Chadwick Rd
- 5528 Aberdeen Rd