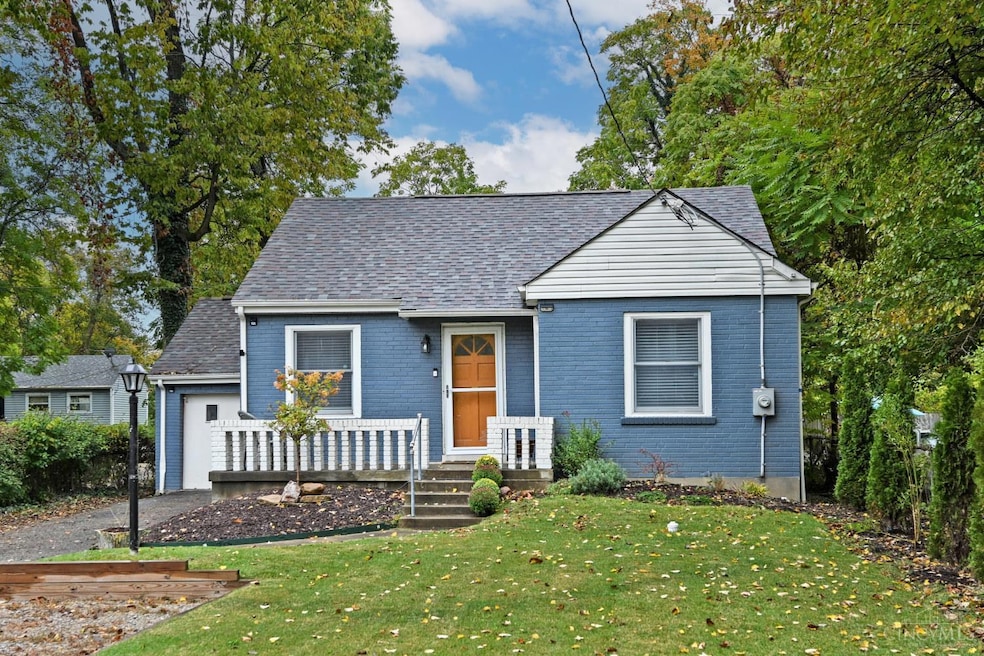

5519 Stewart Rd Cincinnati, OH 45227
Madisonville NeighborhoodEstimated payment $1,521/month
Highlights
- View of Trees or Woods
- 0.46 Acre Lot
- No HOA
- Walnut Hills High School Rated A+
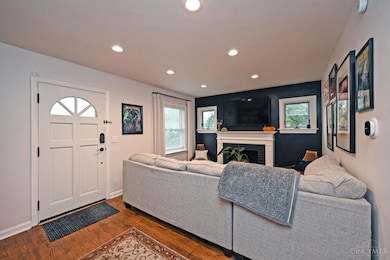
- Ranch Style House
- 4-minute walk to Madisonville Recreation Center
About This Home
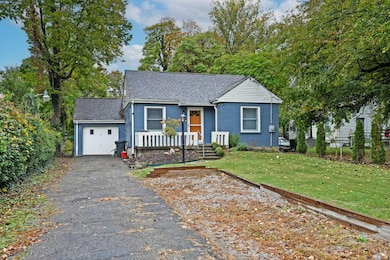
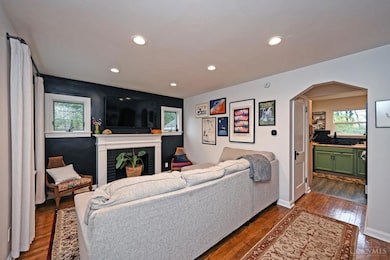
This charming home in Columbia Twp has so much to offer - recently remodeled, large yard and front porch, double wide driveway, and an eat-in kitchen! If you're looking for a great, easy to care-for home on a nice lot that's close to everything nearby Madisonville has to offer, you've found it!

Home Details
Home Type
- Single Family
Est. Annual Taxes
- $3,462
Year Built
- Built in 1941
Lot Details
- 0.46 Acre Lot
- Lot Dimensions are 50 x 326
- Aluminum or Metal Fence
Parking
- 1 Car Attached Garage
- Front Facing Garage
- Driveway
- Off-Street Parking
Home Design
- Ranch Style House
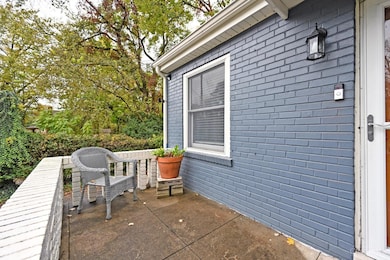
- Brick Exterior Construction
- Poured Concrete
- Shingle Roof
Interior Spaces
- 776 Sq Ft Home
- Vinyl Clad Windows
- Insulated Windows
- Views of Woods
- Unfinished Basement
- Basement Fills Entire Space Under The House
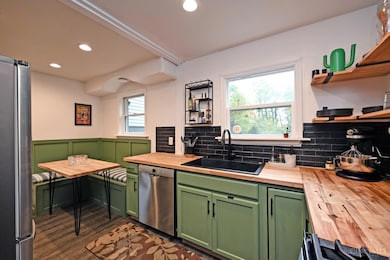
Kitchen
- Eat-In Kitchen
- Oven or Range
- Microwave
- Dishwasher
Bedrooms and Bathrooms
- 2 Bedrooms
- 1 Full Bathroom
- Bathtub with Shower
Laundry
- Dryer
- Washer
Outdoor Features
- Porch
Utilities
- Forced Air Heating and Cooling System
- Heating System Uses Gas
- Gas Water Heater
Community Details
- No Home Owners Association
Map
Home Values in the Area
Average Home Value in this Area
Tax History
| Year | Tax Paid | Tax Assessment Tax Assessment Total Assessment is a certain percentage of the fair market value that is determined by local assessors to be the total taxable value of land and additions on the property. | Land | Improvement |
|---|---|---|---|---|
| 2024 | $3,462 | $56,001 | $5,835 | $50,166 |
| 2023 | $3,533 | $56,001 | $5,835 | $50,166 |
| 2022 | $1,411 | $17,924 | $4,911 | $13,013 |
| 2021 | $1,404 | $17,924 | $4,911 | $13,013 |
| 2020 | $1,400 | $17,924 | $4,911 | $13,013 |
| 2019 | $1,447 | $16,444 | $4,505 | $11,939 |
| 2018 | $1,448 | $16,444 | $4,505 | $11,939 |
| 2017 | $1,407 | $16,444 | $4,505 | $11,939 |
| 2016 | $1,364 | $15,968 | $4,344 | $11,624 |
| 2015 | $1,235 | $15,968 | $4,344 | $11,624 |
| 2014 | $1,209 | $15,968 | $4,344 | $11,624 |
| 2013 | $1,214 | $15,810 | $4,302 | $11,508 |
Property History
| Date | Event | Price | List to Sale | Price per Sq Ft |
|---|---|---|---|---|
| 12/01/2025 12/01/25 | Price Changed | $235,000 | -2.0% | $303 / Sq Ft |
| 10/30/2025 10/30/25 | For Sale | $239,900 | -- | $309 / Sq Ft |
Purchase History
| Date | Type | Sale Price | Title Company |
|---|---|---|---|
| Warranty Deed | $221,000 | None Listed On Document | |
| Warranty Deed | $221,000 | None Listed On Document | |
| Warranty Deed | -- | None Listed On Document | |
| Warranty Deed | $70,000 | None Available | |
| Certificate Of Transfer | -- | Attorney |
Mortgage History
| Date | Status | Loan Amount | Loan Type |
|---|---|---|---|
| Open | $214,370 | New Conventional | |
| Closed | $214,370 | New Conventional |
Source: MLS of Greater Cincinnati (CincyMLS)
MLS Number: 1860303
APN: 520-0215-0038
Disclaimer: Certain information contained herein is derived from information provided by parties other than Homes.com. All information provided is deemed reliable, but is not guaranteed to be accurate and should be independently verified.
![]() The data relating to real estate for sale on this website comes in part from the Broker Reciprocity programs of the MLS of Greater Cincinnati, Inc.. Those listings held by brokerage firms other than Ten-X are marked with the Broker Reciprocity logo and house icon. The properties displayed may not be all of the properties available through Broker Reciprocity.
The data relating to real estate for sale on this website comes in part from the Broker Reciprocity programs of the MLS of Greater Cincinnati, Inc.. Those listings held by brokerage firms other than Ten-X are marked with the Broker Reciprocity logo and house icon. The properties displayed may not be all of the properties available through Broker Reciprocity.
IDX information is provided exclusively for personal, non-commercial use, and may not be used for any purpose other than to identify prospective properties consumers may be interested in purchasing.
Information is deemed reliable but not guaranteed.
Ten-X does not display the entire Cincinnati MLS Broker Reciprocity™ database on this web site. The listings of some real estate brokerage firms have been excluded.
Copyright 2025, MLS of Greater Cincinnati, Inc. All rights reserved
- 5504 Stewart Ave
- 5312 Dora St
- 5439 Whetsel Ave
- 5899 Jordan Ln
- 5610 Chandler St
- 5521 Chandler St
- 5619 Chandler St
- 5317 Whetsel Ave
- 5330 Whetsel Ave
- 5123 Stewart Ave
- 5103 Ebersole Ave
- 5112 Ebersole Ave
- 5900 Woodland Ln
- 5335 Owasco St
- 5454 Owasco St
- 5960 Woodland Ln
- Phase 2 5912 Plan at Woodland Vistas
- Phase 2 5918 Plan at Woodland Vistas
- 5534 Stewart Ave Unit 3
- 5314 Ward St
- 5540 Madison Rd
- 5829 Madison Rd
- 6011 Madison Rd Unit 6
- 5123 Glenshade Ave
- 5110 Herringbone Dr
- 5363 Tompkins Ave
- 6503 E Ledge St
- 4488 Butterfield Place
- 4486 Butterfield Place
- 4480 Butterfield Place
- 4478 Butterfield Place
- 4929 Kelsch Ln Unit 1
- 5639 Macey Ave
- 6109 Kenwood Rd
- 4905 Oaklawn Dr
- 3742 Anioton Ct
- 4403 Simpson Ave
- 5651 Bramble Ave Unit 1