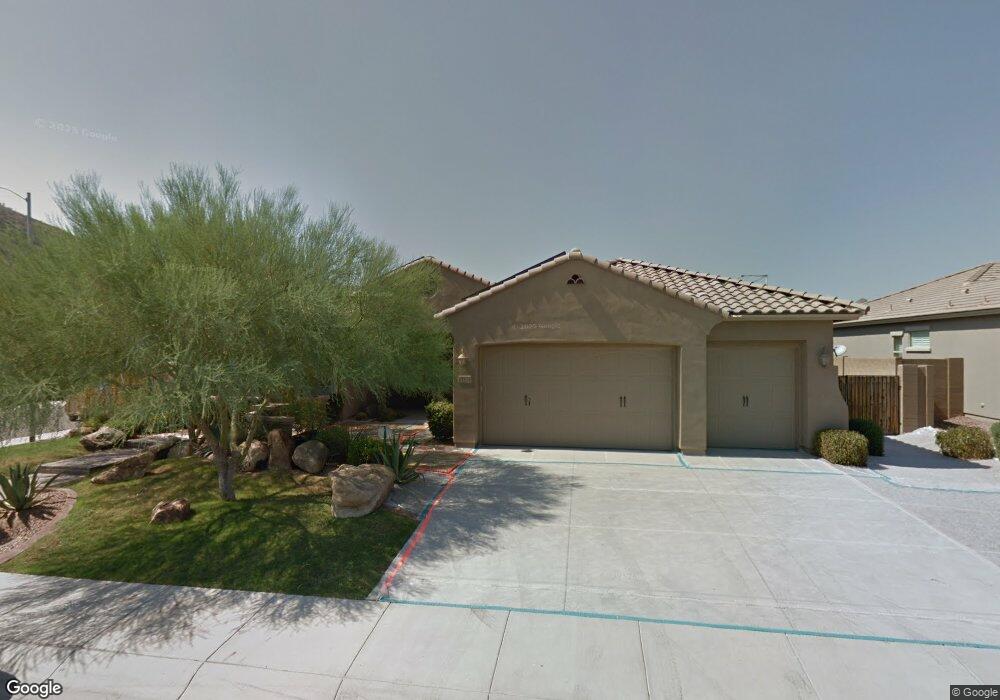
5522 W Yearling Rd Phoenix, AZ 85083
Stetson Valley NeighborhoodEstimated Value: $724,239 - $824,000
4
Beds
3
Baths
2,595
Sq Ft
$298/Sq Ft
Est. Value
About This Home
This home is located at 5522 W Yearling Rd, Phoenix, AZ 85083 and is currently estimated at $774,310, approximately $298 per square foot. 5522 W Yearling Rd is a home located in Maricopa County with nearby schools including Sandra Day O'connor High School, Hillcrest Middle School, and Happy Valley School.
Ownership History
Date
Name
Owned For
Owner Type
Purchase Details
Closed on
Jan 25, 2010
Sold by
Roth Myron Lee and Roth Patricia Anne
Bought by
Roth Myron Lee and Roth Patricia Anne
Current Estimated Value
Purchase Details
Closed on
Dec 9, 2009
Sold by
Mize Taylor L
Bought by
Roth Myron and Roth Patty
Purchase Details
Closed on
Feb 11, 2009
Sold by
Mize Taylor L
Bought by
Thill Matthew and 5522 W Yearling Rd Trust
Purchase Details
Closed on
Jun 29, 2006
Sold by
Pulte Home Corp
Bought by
Mize Taylor L
Home Financials for this Owner
Home Financials are based on the most recent Mortgage that was taken out on this home.
Original Mortgage
$445,296
Interest Rate
6.75%
Mortgage Type
New Conventional
Purchase Details
Closed on
Jan 26, 2006
Sold by
Stetson Venture Ii Llc
Bought by
Pulte Home Corp
Create a Home Valuation Report for This Property
The Home Valuation Report is an in-depth analysis detailing your home's value as well as a comparison with similar homes in the area
Home Values in the Area
Average Home Value in this Area
Purchase History
| Date | Buyer | Sale Price | Title Company |
|---|---|---|---|
| Roth Myron Lee | -- | None Available | |
| Roth Myron | $292,726 | None Available | |
| Thill Matthew | -- | None Available | |
| Mize Taylor L | $474,111 | Sun Title Agency Co | |
| Pulte Home Corp | $5,954,229 | Title Security Agency Of Az |
Source: Public Records
Mortgage History
| Date | Status | Borrower | Loan Amount |
|---|---|---|---|
| Previous Owner | Mize Taylor L | $445,296 |
Source: Public Records
Tax History Compared to Growth
Tax History
| Year | Tax Paid | Tax Assessment Tax Assessment Total Assessment is a certain percentage of the fair market value that is determined by local assessors to be the total taxable value of land and additions on the property. | Land | Improvement |
|---|---|---|---|---|
| 2025 | $4,636 | $45,201 | -- | -- |
| 2024 | $4,503 | $43,049 | -- | -- |
| 2023 | $4,503 | $52,220 | $10,440 | $41,780 |
| 2022 | $4,352 | $40,270 | $8,050 | $32,220 |
| 2021 | $4,468 | $37,610 | $7,520 | $30,090 |
| 2020 | $4,390 | $35,670 | $7,130 | $28,540 |
| 2019 | $4,264 | $33,730 | $6,740 | $26,990 |
| 2018 | $4,293 | $33,400 | $6,680 | $26,720 |
| 2017 | $4,159 | $31,850 | $6,370 | $25,480 |
| 2016 | $3,992 | $30,820 | $6,160 | $24,660 |
| 2015 | $3,578 | $31,720 | $6,340 | $25,380 |
Source: Public Records
Map
Nearby Homes
- 26318 N 56th Dr
- 5131 W El Cortez Trail
- 5046 W Parsons Rd
- 5026 W Parsons Rd
- 26704 N 55th Ave
- 5123 W Saddlehorn Rd
- 5136 W Trotter Trail
- 3310 W Jomax Rd
- 25914 N 49th Ln
- 5452 W West Wind Dr
- 5121 W Andrea Ln
- 5322 W Whispering Wind Dr
- 25417 N 49th Dr
- 5343 W Whispering Wind Dr
- 5537 W Desperado Way
- 2965 W Pinnacle Vista Dr
- 5909 W Fetlock Trail
- 5815 W Straight Arrow Ln
- 27321 N 51st Glen
- 5208 W Straight Arrow Ln
- 5518 W Yearling Rd
- 5509 W Paso Trail
- 5526 W Yearling Rd
- 5514 W Yearling Rd
- 5505 W Paso Trail
- 5519 W Yearling Rd
- 5515 W Yearling Rd
- 5429 W Paso Trail
- 5510 W Yearling Rd
- 5511 W Yearling Rd
- 5527 W Yearling Rd
- 5516 W Parsons Rd
- 5507 W Yearling Rd
- 5512 W Parsons Rd
- 25618 N 55th Ln
- 5520 W Parsons Rd
- 5425 W Paso Trail
- 5506 W Yearling Rd
- 5508 W Parsons Rd
- 25613 N 55th Ln