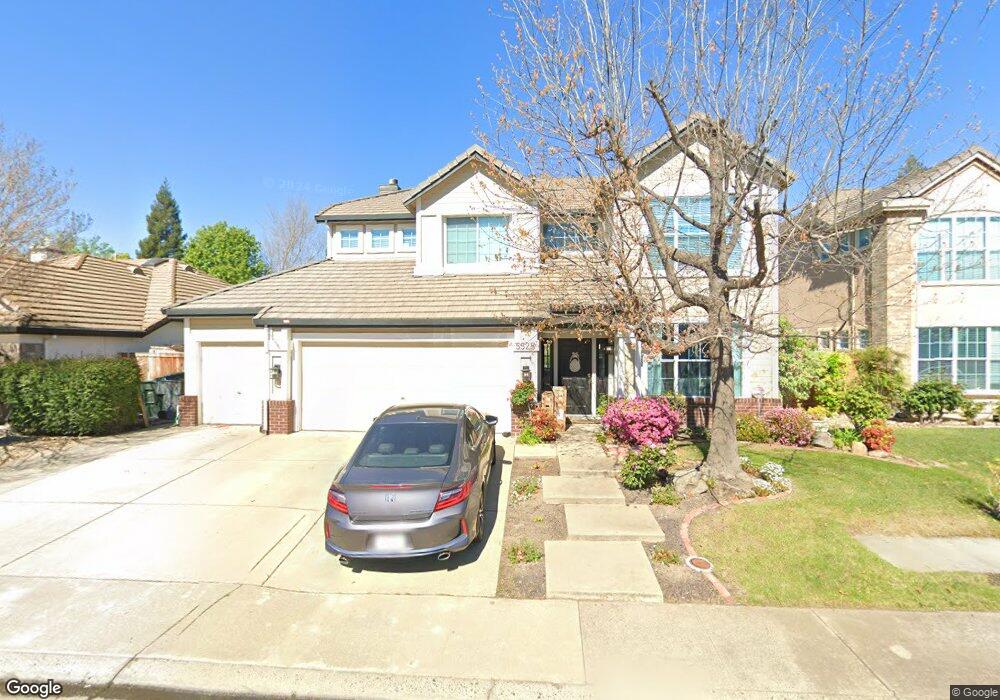
5528 Tripp Way Rocklin, CA 95765
Stanford Ranch NeighborhoodEstimated Value: $547,000 - $803,000
6
Beds
3
Baths
2,974
Sq Ft
$235/Sq Ft
Est. Value
About This Home
This home is located at 5528 Tripp Way, Rocklin, CA 95765 and is currently estimated at $699,622, approximately $235 per square foot. 5528 Tripp Way is a home located in Placer County with nearby schools including Twin Oaks Elementary, Granite Oaks Middle, and Rocklin High.
Ownership History
Date
Name
Owned For
Owner Type
Purchase Details
Closed on
Nov 14, 2018
Sold by
Zorro Steven R and Zorro Kimberle R
Bought by
Zorro Steven R
Current Estimated Value
Purchase Details
Closed on
Jan 23, 2003
Sold by
Zorro Steven R and Zorro Kimberly R
Bought by
Zorro Steven R and Zorro Kimberly R
Home Financials for this Owner
Home Financials are based on the most recent Mortgage that was taken out on this home.
Original Mortgage
$170,000
Outstanding Balance
$72,260
Interest Rate
5.97%
Estimated Equity
$627,362
Purchase Details
Closed on
Dec 9, 1997
Sold by
Smc Development Corp
Bought by
Zorro Steven R and Zorro Kimberle R
Home Financials for this Owner
Home Financials are based on the most recent Mortgage that was taken out on this home.
Original Mortgage
$177,000
Interest Rate
7.23%
Create a Home Valuation Report for This Property
The Home Valuation Report is an in-depth analysis detailing your home's value as well as a comparison with similar homes in the area
Home Values in the Area
Average Home Value in this Area
Purchase History
| Date | Buyer | Sale Price | Title Company |
|---|---|---|---|
| Zorro Steven R | -- | North American Title Co Inc | |
| Zorro Steven R | -- | North American Title Co | |
| Zorro Steven R | $215,000 | Placer Title Company |
Source: Public Records
Mortgage History
| Date | Status | Borrower | Loan Amount |
|---|---|---|---|
| Open | Zorro Steven R | $170,000 | |
| Closed | Zorro Steven R | $177,000 |
Source: Public Records
Tax History Compared to Growth
Tax History
| Year | Tax Paid | Tax Assessment Tax Assessment Total Assessment is a certain percentage of the fair market value that is determined by local assessors to be the total taxable value of land and additions on the property. | Land | Improvement |
|---|---|---|---|---|
| 2025 | $3,814 | $343,186 | $137,273 | $205,913 |
| 2023 | $3,814 | $329,862 | $131,944 | $197,918 |
| 2022 | $3,693 | $323,395 | $129,357 | $194,038 |
| 2021 | $3,653 | $317,055 | $126,821 | $190,234 |
| 2020 | $3,647 | $313,805 | $125,521 | $188,284 |
| 2019 | $3,598 | $307,653 | $123,060 | $184,593 |
| 2018 | $4,478 | $301,622 | $120,648 | $180,974 |
| 2017 | $4,452 | $295,709 | $118,283 | $177,426 |
| 2016 | $4,328 | $289,912 | $115,964 | $173,948 |
| 2015 | $4,260 | $285,559 | $114,223 | $171,336 |
| 2014 | $4,837 | $279,966 | $111,986 | $167,980 |
Source: Public Records
Map
Nearby Homes
- 5615 Darby Rd
- 5401 Sandpiper Ct
- 1914 Harvest Ct
- 5919 Blackstone Dr
- 5704 Byron Ct
- 5563 Cabrillo Ct
- 2024 Archer Cir
- 2920 Avon Rd
- 5403 Sage Ct
- 5406 Sage Ct
- 5362 Delta Dr
- 5405 Sage Ct
- 1402 Skibbereen Way
- 1404 Indiana Way Unit 72
- 1405 Indiana Way
- 1816 Illinois Way Unit 48
- 3324 Sandalwood Rd
- 5248 Bay St
- 5651 Blackrock Rd
- 6261 Arctic Loon Way