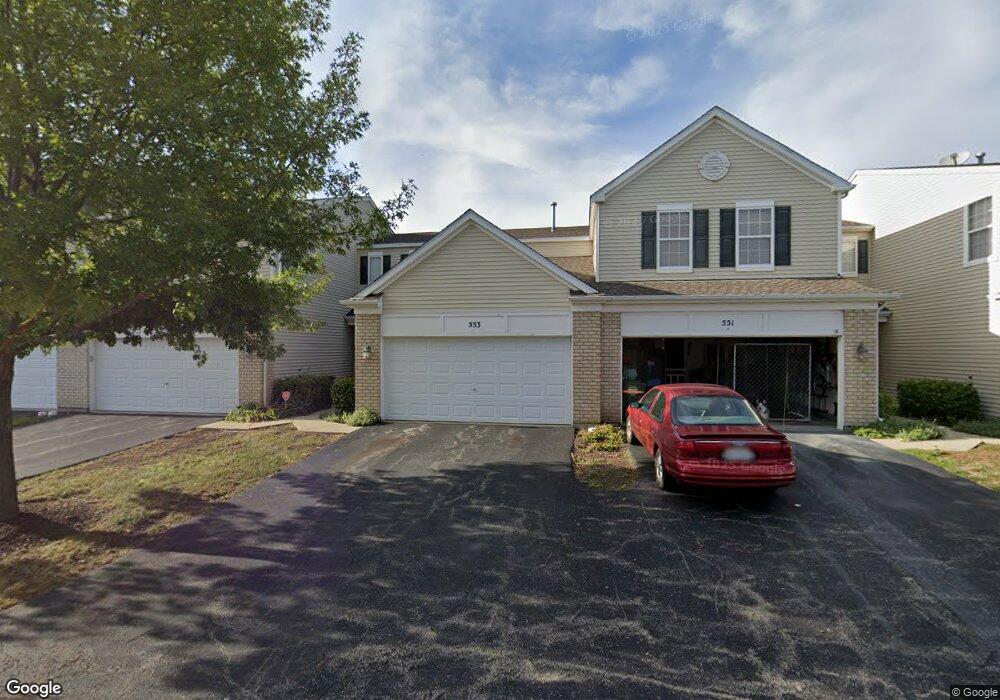
553 Springbrook Trail N Unit 1 Oswego, IL 60543
North Oswego NeighborhoodEstimated Value: $242,000 - $260,772
2
Beds
2
Baths
1,223
Sq Ft
$207/Sq Ft
Est. Value
About This Home
This home is located at 553 Springbrook Trail N Unit 1, Oswego, IL 60543 and is currently estimated at $253,693, approximately $207 per square foot. 553 Springbrook Trail N Unit 1 is a home located in Kendall County with nearby schools including Long Beach Elementary School, Plank Junior High School, and Oswego East High School.
Ownership History
Date
Name
Owned For
Owner Type
Purchase Details
Closed on
Jul 24, 2020
Sold by
Covino Christopher M and Covino Blair
Bought by
Koster Teresa Kay
Current Estimated Value
Home Financials for this Owner
Home Financials are based on the most recent Mortgage that was taken out on this home.
Original Mortgage
$158,083
Outstanding Balance
$139,247
Interest Rate
2.75%
Mortgage Type
FHA
Estimated Equity
$114,446
Purchase Details
Closed on
Aug 1, 2004
Sold by
Centex Homes
Bought by
Covino Christopher M
Home Financials for this Owner
Home Financials are based on the most recent Mortgage that was taken out on this home.
Original Mortgage
$169,119
Interest Rate
6.08%
Mortgage Type
FHA
Create a Home Valuation Report for This Property
The Home Valuation Report is an in-depth analysis detailing your home's value as well as a comparison with similar homes in the area
Home Values in the Area
Average Home Value in this Area
Purchase History
| Date | Buyer | Sale Price | Title Company |
|---|---|---|---|
| Koster Teresa Kay | $161,000 | Baird & Warner Ttl Svcs Inc | |
| Covino Christopher M | $172,000 | Chicago Title Insurance Co |
Source: Public Records
Mortgage History
| Date | Status | Borrower | Loan Amount |
|---|---|---|---|
| Open | Koster Teresa Kay | $158,083 | |
| Previous Owner | Covino Christopher M | $169,119 |
Source: Public Records
Tax History Compared to Growth
Tax History
| Year | Tax Paid | Tax Assessment Tax Assessment Total Assessment is a certain percentage of the fair market value that is determined by local assessors to be the total taxable value of land and additions on the property. | Land | Improvement |
|---|---|---|---|---|
| 2024 | $5,199 | $70,601 | $12,992 | $57,609 |
| 2023 | $4,639 | $61,392 | $11,297 | $50,095 |
| 2022 | $4,639 | $57,376 | $10,558 | $46,818 |
| 2021 | $4,456 | $53,622 | $9,867 | $43,755 |
| 2020 | $4,919 | $52,061 | $9,580 | $42,481 |
| 2019 | $4,997 | $52,061 | $9,580 | $42,481 |
| 2018 | $4,313 | $44,367 | $8,164 | $36,203 |
| 2017 | $4,192 | $40,891 | $7,524 | $33,367 |
| 2016 | $3,867 | $37,174 | $6,840 | $30,334 |
| 2015 | $3,621 | $33,191 | $6,107 | $27,084 |
| 2014 | -- | $31,312 | $5,761 | $25,551 |
| 2013 | -- | $34,035 | $6,262 | $27,773 |
Source: Public Records
Map
Nearby Homes
- 121 Springbrook Trail S
- 235 Springbrook Trail S Unit 1
- 295 Springbrook Trail S
- 0000 Fifth St
- 610 Salem Cir
- 2071 Wiesbrook Dr
- 215 Long Beach Rd
- 712 Bohannon Cir
- 404 Kent Ct
- 457 Newport Cir
- 623 Queen Dr
- 786 Bohannon Cir
- 790 Bohannon Cir
- 222 Mondovi Dr
- 122 Longbeach Rd
- 136 Heathgate Rd
- 124 Heathgate Rd
- 22 Alex Ct Unit 1
- 36 Fallcreek Cir Unit 35
- 37 Fallcreek Cir
- 555 Springbrook Trail N Unit 1
- 555 Springbrook Trail N Unit 555
- 557 Springbrook Trail N Unit 1
- 551 Springbrook Trail N Unit 1
- 561 Springbrook Trail N Unit 2
- 549 Springbrook Trail N
- 563 Springbrook Trail N Unit 2
- 547 Springbrook Trail N
- 565 Springbrook Trail N
- 565 Springbrook Trail N Unit 261
- 546 Springbrook Trail N
- 546 Springbrook Trail N Unit N
- 468 Brookside Dr
- 545 Springbrook Trail N
- 567 Springbrook Trail N
- 544 Springbrook Trail N
- 544 Springbrook Trail N Unit 1
- 542 Springbrook Trail N
- 543 Springbrook Trail N Unit 1
- 470 Brookside Dr