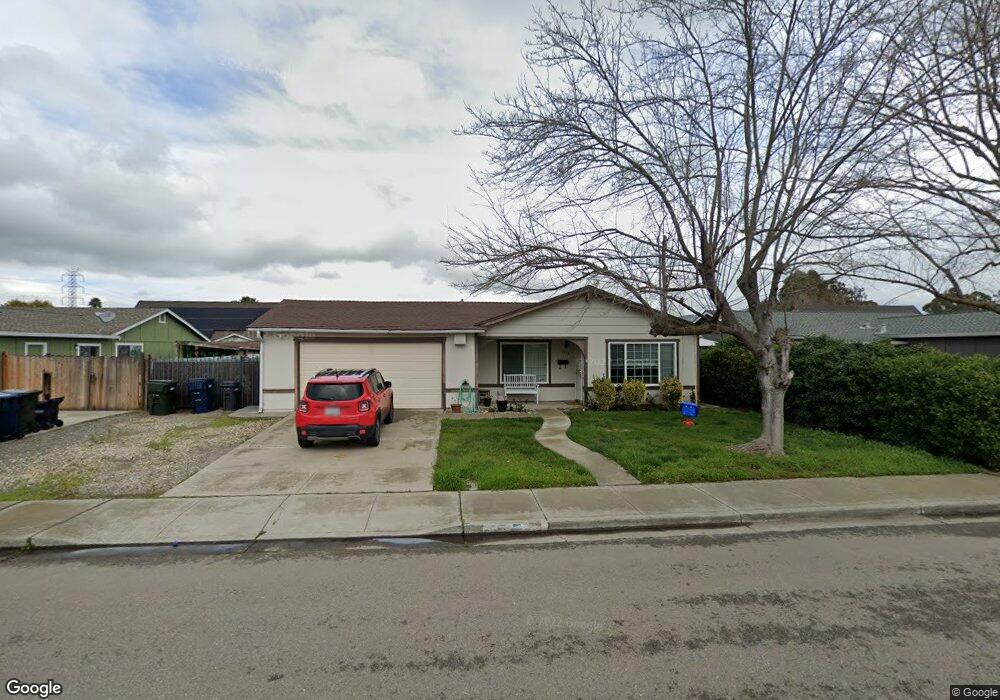
5534 Idlewild Ave Livermore, CA 94551
Springtown NeighborhoodEstimated Value: $869,000 - $971,000
4
Beds
2
Baths
1,261
Sq Ft
$745/Sq Ft
Est. Value
About This Home
This home is located at 5534 Idlewild Ave, Livermore, CA 94551 and is currently estimated at $939,887, approximately $745 per square foot. 5534 Idlewild Ave is a home located in Alameda County with nearby schools including Altamont Creek Elementary School, Andrew N. Christensen Middle School, and Livermore High School.
Ownership History
Date
Name
Owned For
Owner Type
Purchase Details
Closed on
Aug 27, 2008
Sold by
The Bank Of New York
Bought by
Wingerd Paul and Wingerd Suzanne M
Current Estimated Value
Home Financials for this Owner
Home Financials are based on the most recent Mortgage that was taken out on this home.
Original Mortgage
$292,000
Outstanding Balance
$194,035
Interest Rate
6.5%
Mortgage Type
Purchase Money Mortgage
Estimated Equity
$745,852
Purchase Details
Closed on
Jun 26, 2008
Sold by
Rodriguez Marco and Rodriguez Hazel
Bought by
The Bank Of New York and Jpmorgan Chase Bank Na
Purchase Details
Closed on
Nov 16, 2005
Sold by
Kurtzer Charles W and Charles W Kurtzer Trust
Bought by
Rodriguez Marco and Rodriguez Hazel
Home Financials for this Owner
Home Financials are based on the most recent Mortgage that was taken out on this home.
Original Mortgage
$406,500
Interest Rate
6.62%
Mortgage Type
Balloon
Create a Home Valuation Report for This Property
The Home Valuation Report is an in-depth analysis detailing your home's value as well as a comparison with similar homes in the area
Home Values in the Area
Average Home Value in this Area
Purchase History
| Date | Buyer | Sale Price | Title Company |
|---|---|---|---|
| Wingerd Paul | $365,000 | Lsi Title Company | |
| The Bank Of New York | $319,550 | None Available | |
| Rodriguez Marco | $542,000 | Commonwealth Land Title Co |
Source: Public Records
Mortgage History
| Date | Status | Borrower | Loan Amount |
|---|---|---|---|
| Open | Wingerd Paul | $292,000 | |
| Previous Owner | Rodriguez Marco | $406,500 |
Source: Public Records
Tax History Compared to Growth
Tax History
| Year | Tax Paid | Tax Assessment Tax Assessment Total Assessment is a certain percentage of the fair market value that is determined by local assessors to be the total taxable value of land and additions on the property. | Land | Improvement |
|---|---|---|---|---|
| 2025 | $6,298 | $462,998 | $140,999 | $328,999 |
| 2024 | $6,298 | $453,786 | $138,236 | $322,550 |
| 2023 | $6,194 | $451,752 | $135,525 | $316,227 |
| 2022 | $6,096 | $435,897 | $132,869 | $310,028 |
| 2021 | $5,223 | $427,214 | $130,264 | $303,950 |
| 2020 | $5,784 | $429,764 | $128,929 | $300,835 |
| 2019 | $5,801 | $421,340 | $126,402 | $294,938 |
| 2018 | $5,668 | $413,081 | $123,924 | $289,157 |
| 2017 | $5,516 | $404,981 | $121,494 | $283,487 |
| 2016 | $5,303 | $397,043 | $119,113 | $277,930 |
| 2015 | $4,980 | $391,082 | $117,324 | $273,758 |
| 2014 | $4,890 | $383,424 | $115,027 | $268,397 |
Source: Public Records
Map
Nearby Homes
- 5904 Skylinks Way
- 0 Dalton Ave Unit 225094100
- 6373 Altamar Cir
- 5740 Woodrose Way
- 1464 Columbine Way
- 1775 Rose Gate Common
- 5889 Woodrose Way
- 1806 Bluebell Dr
- 1370 Daisy Ln
- 1688 Bluebell Dr
- 5801 Flora Common
- 1304 Heather Ln
- 1333 Daisy Ln
- 6432 Laurel Creek Place
- 2135 Bluebell Dr
- 5179 Crocus Way
- 883 Barney Com
- 1241 Hibiscus Way
- 2013 Galloway Common
- 829 Berryessa Ct
- 5548 Idlewild Ave
- 5526 Idlewild Ave
- 5539 Firestone Rd
- 5521 Firestone Rd
- 5545 Firestone Rd
- 5552 Idlewild Ave
- 5510 Idlewild Ave
- 5535 Idlewild Ave
- 5547 Idlewild Ave
- 5557 Firestone Rd
- 5513 Firestone Rd
- 5529 Idlewild Ave
- 5551 Idlewild Ave
- 5570 Idlewild Ave
- 5511 Idlewild Ave
- 5504 Idlewild Ave
- 5579 Firestone Rd
- 5505 Firestone Rd
- 5685 Oakmont Cir
- 5569 Idlewild Ave