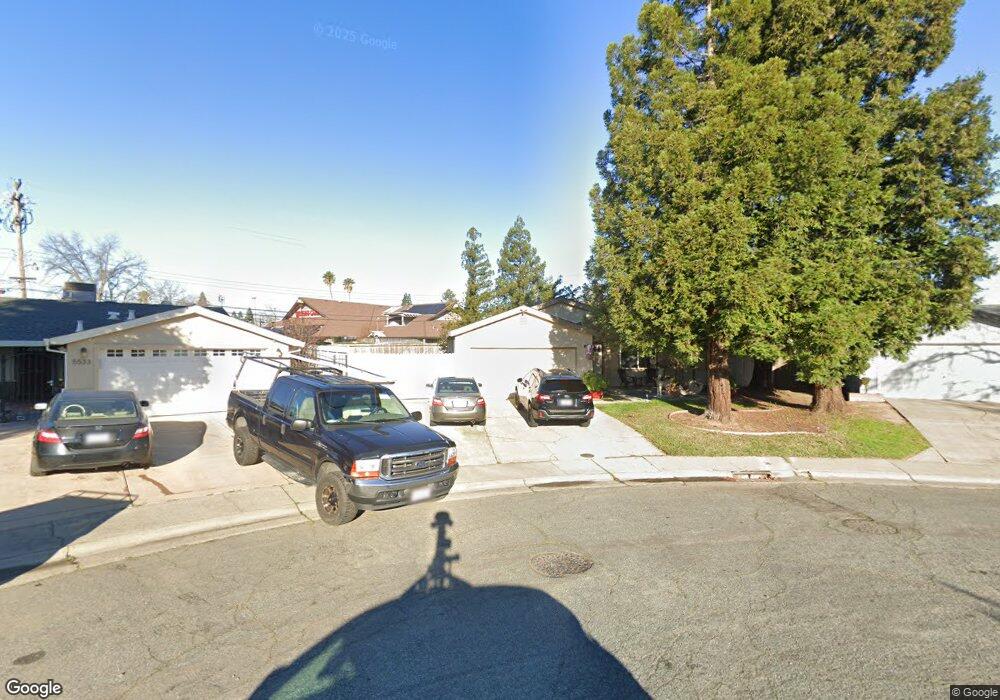
5537 Sapunor Way Carmichael, CA 95608
Merrihill NeighborhoodEstimated Value: $289,000 - $438,000
3
Beds
2
Baths
1,078
Sq Ft
$351/Sq Ft
Est. Value
About This Home
This home is located at 5537 Sapunor Way, Carmichael, CA 95608 and is currently estimated at $377,911, approximately $350 per square foot. 5537 Sapunor Way is a home located in Sacramento County with nearby schools including Charles Peck Elementary School, Will Rogers Middle School, and San Juan High School.
Ownership History
Date
Name
Owned For
Owner Type
Purchase Details
Closed on
May 30, 2014
Sold by
Thr California Lp
Bought by
2014-1 Ih Borrower Lp
Current Estimated Value
Home Financials for this Owner
Home Financials are based on the most recent Mortgage that was taken out on this home.
Original Mortgage
$993,738,000
Outstanding Balance
$757,278,384
Interest Rate
4.25%
Mortgage Type
Stand Alone Refi Refinance Of Original Loan
Estimated Equity
-$756,900,473
Purchase Details
Closed on
Feb 19, 2013
Sold by
Nelsen Brian B and Nelsen Jennifer Anne
Bought by
Thr California Lp
Purchase Details
Closed on
Jul 27, 1999
Sold by
Federal National Mortgage Association
Bought by
Nelsen Brian B and Nelsen Jennifer Anne
Home Financials for this Owner
Home Financials are based on the most recent Mortgage that was taken out on this home.
Original Mortgage
$118,817
Interest Rate
7.64%
Mortgage Type
FHA
Purchase Details
Closed on
Nov 19, 1998
Sold by
Lugo Donald M and Lugo Rita R
Bought by
Federal National Mortgage Association
Create a Home Valuation Report for This Property
The Home Valuation Report is an in-depth analysis detailing your home's value as well as a comparison with similar homes in the area
Home Values in the Area
Average Home Value in this Area
Purchase History
| Date | Buyer | Sale Price | Title Company |
|---|---|---|---|
| 2014-1 Ih Borrower Lp | -- | None Available | |
| Thr California Lp | $138,152 | None Available | |
| Nelsen Brian B | $119,000 | Fidelity National Title Co | |
| Federal National Mortgage Association | $98,750 | First Southwestern Title Co |
Source: Public Records
Mortgage History
| Date | Status | Borrower | Loan Amount |
|---|---|---|---|
| Open | 2014-1 Ih Borrower Lp | $993,738,000 | |
| Previous Owner | Nelsen Brian B | $118,817 | |
| Closed | Nelsen Brian B | $5,950 |
Source: Public Records
Tax History Compared to Growth
Tax History
| Year | Tax Paid | Tax Assessment Tax Assessment Total Assessment is a certain percentage of the fair market value that is determined by local assessors to be the total taxable value of land and additions on the property. | Land | Improvement |
|---|---|---|---|---|
| 2025 | $3,836 | $324,957 | $92,843 | $232,114 |
| 2024 | $3,836 | $318,586 | $91,023 | $227,563 |
| 2023 | $3,738 | $312,340 | $89,239 | $223,101 |
| 2022 | $3,719 | $306,217 | $87,490 | $218,727 |
| 2021 | $3,657 | $310,936 | $85,775 | $225,161 |
| 2020 | $3,717 | $307,749 | $84,896 | $222,853 |
| 2019 | $3,642 | $301,716 | $83,232 | $218,484 |
| 2018 | $2,074 | $169,911 | $48,700 | $121,211 |
| 2017 | $2,054 | $166,581 | $47,746 | $118,835 |
| 2016 | $1,919 | $163,315 | $46,810 | $116,505 |
| 2015 | $1,886 | $160,862 | $46,107 | $114,755 |
| 2014 | $1,847 | $157,712 | $45,204 | $112,508 |
Source: Public Records
Map
Nearby Homes
- 5916 Casa Alegre
- 5904 Casa Alegre
- 5942 Ashworth Way
- 5907 Casa Alegre
- 5931 Via Casitas
- 6101 Coyle Ave
- 5317 Manzanita Ave Unit 1
- 5802 Shadow Creek Dr Unit 1
- 5822 Shadow Creek Dr
- 6028 Via Casitas
- 5433 Edgerly Way
- 6124 Orsi Cir
- 6147 Orsi Cir
- 5836 Peppermill Ct Unit 3
- 5965 Hilltop Dr
- 5245 Manzanita Ave Unit 2
- 5245 Manzanita Ave Unit 3
- 5561 White Fir Way
- 5735 Hesper Way
- 6106 Madison Ave
- 5541 Sapunor Way
- 5533 Sapunor Way
- 5920 Coyle Ave
- 5924 Coyle Ave
- 5545 Sapunor Way
- 5529 Sapunor Way
- 5928 Coyle Ave
- 5540 Manzanita Ave
- 5900 Coyle Ave
- 5540 Sapunor Way
- 5932 Coyle Ave
- 5549 Sapunor Way
- 5536 Manzanita Ave
- 5525 Sapunor Way
- 5548 Sapunor Way
- 5936 Coyle Ave
- 5532 Manzanita Ave
- 5553 Sapunor Way
- 5521 Sapunor Way
- 6048 Casa Alegre