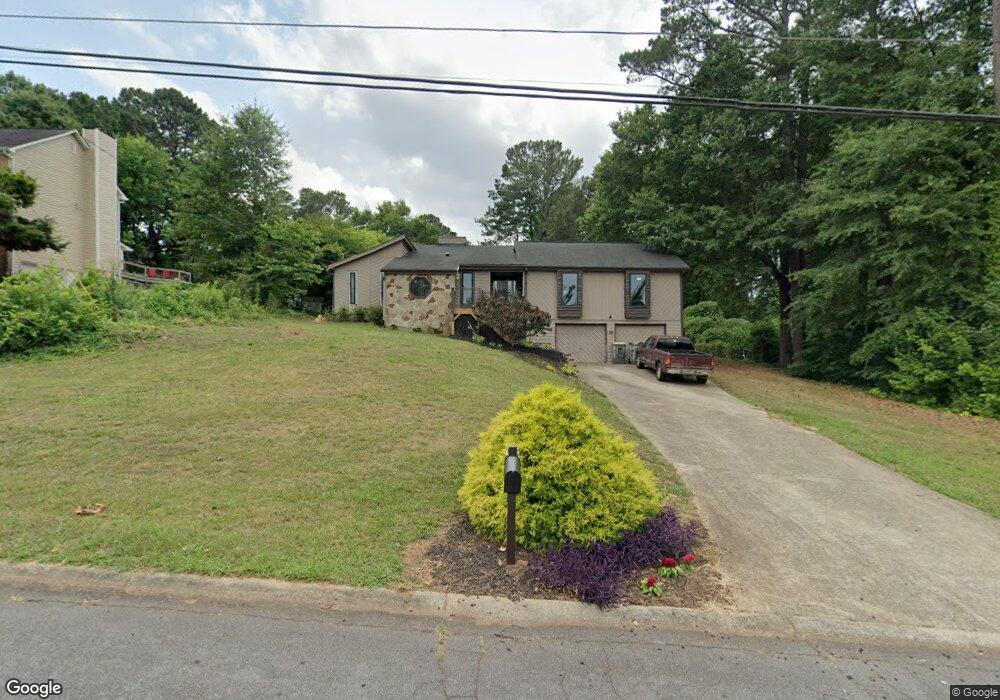
554 Charing Cross Dr Unit 3 Marietta, GA 30066
Sandy Plains NeighborhoodEstimated Value: $394,000 - $425,537
3
Beds
2
Baths
1,823
Sq Ft
$226/Sq Ft
Est. Value
About This Home
This home is located at 554 Charing Cross Dr Unit 3, Marietta, GA 30066 and is currently estimated at $411,634, approximately $225 per square foot. 554 Charing Cross Dr Unit 3 is a home located in Cobb County with nearby schools including Blackwell Elementary School, Daniell Middle School, and Sprayberry High School.
Ownership History
Date
Name
Owned For
Owner Type
Purchase Details
Closed on
Sep 10, 2004
Sold by
Coggins Carey
Bought by
Coggins Rachel
Current Estimated Value
Home Financials for this Owner
Home Financials are based on the most recent Mortgage that was taken out on this home.
Original Mortgage
$105,000
Interest Rate
5.78%
Purchase Details
Closed on
Aug 30, 2004
Sold by
Walker Anthony J and Walker Joy
Bought by
Sunbelt Real Estate Co
Home Financials for this Owner
Home Financials are based on the most recent Mortgage that was taken out on this home.
Original Mortgage
$105,000
Interest Rate
5.78%
Purchase Details
Closed on
Sep 23, 1994
Sold by
Baker Richard S Carolyn
Bought by
Walker Anthony J
Home Financials for this Owner
Home Financials are based on the most recent Mortgage that was taken out on this home.
Original Mortgage
$105,450
Interest Rate
8.53%
Create a Home Valuation Report for This Property
The Home Valuation Report is an in-depth analysis detailing your home's value as well as a comparison with similar homes in the area
Home Values in the Area
Average Home Value in this Area
Purchase History
| Date | Buyer | Sale Price | Title Company |
|---|---|---|---|
| Coggins Rachel | $125,000 | -- | |
| Sunbelt Real Estate Co | $116,400 | -- | |
| Coggins Carey | $125,000 | -- | |
| Walker Anthony J | $111,000 | -- |
Source: Public Records
Mortgage History
| Date | Status | Borrower | Loan Amount |
|---|---|---|---|
| Closed | Coggins Rachel | $105,000 | |
| Previous Owner | Walker Anthony J | $105,450 |
Source: Public Records
Tax History Compared to Growth
Tax History
| Year | Tax Paid | Tax Assessment Tax Assessment Total Assessment is a certain percentage of the fair market value that is determined by local assessors to be the total taxable value of land and additions on the property. | Land | Improvement |
|---|---|---|---|---|
| 2024 | $3,273 | $139,556 | $38,000 | $101,556 |
| 2023 | $2,730 | $139,556 | $38,000 | $101,556 |
| 2022 | $2,876 | $120,232 | $30,000 | $90,232 |
| 2021 | $2,418 | $99,320 | $30,000 | $69,320 |
| 2020 | $2,091 | $84,388 | $24,000 | $60,388 |
| 2019 | $2,091 | $84,388 | $24,000 | $60,388 |
| 2018 | $2,164 | $87,708 | $18,000 | $69,708 |
| 2017 | $1,672 | $68,884 | $16,000 | $52,884 |
| 2016 | $1,673 | $68,884 | $16,000 | $52,884 |
| 2015 | $1,399 | $56,320 | $16,000 | $40,320 |
| 2014 | $1,411 | $56,320 | $0 | $0 |
Source: Public Records
Map
Nearby Homes
- 570 Charing Cross Dr
- 529 Hawkins Store Rd NE
- 651 Charing Cross Dr
- 597 Farmbrook Trail NE
- 750 Alison Jane Ct NE
- 3978 Devonshire Dr
- 336 Nottingham Dr
- 3924 Devonshire Dr
- 559 Farmbrook Trail NE
- 3819 Courson St
- 3776 Westchase Dr
- 589 Whisperwill Dr
- 4110 Oak Ferry Dr NE
- 3674 Canton Rd
- 70 Cedar Valley Dr NE
- 3909 Bellair Dr
- 3920 Bellair Dr
- 4704 Lincoln Dr NE
- 558 Charing Cross Dr
- 550 Charing Cross Dr Unit 3
- 562 Charing Cross Dr Unit 3
- 546 Charing Cross Dr Unit 3
- 511 Buckingham Cir
- 501 Buckingham Cir Unit 2
- 555 Charing Cross Dr
- 521 Buckingham Cir Unit 2
- 0 Charing Cross Dr Unit 7121778
- 0 Charing Cross Dr Unit 8719207
- 0 Charing Cross Dr Unit 8407545
- 0 Charing Cross Dr Unit 8221187
- 0 Charing Cross Dr Unit 8185188
- 0 Charing Cross Dr Unit 8162995
- 0 Charing Cross Dr Unit 8059330
- 0 Charing Cross Dr Unit 8013796
- 0 Charing Cross Dr Unit 8873995
- 0 Charing Cross Dr
- 559 Charing Cross Dr
- 551 Charing Cross Dr