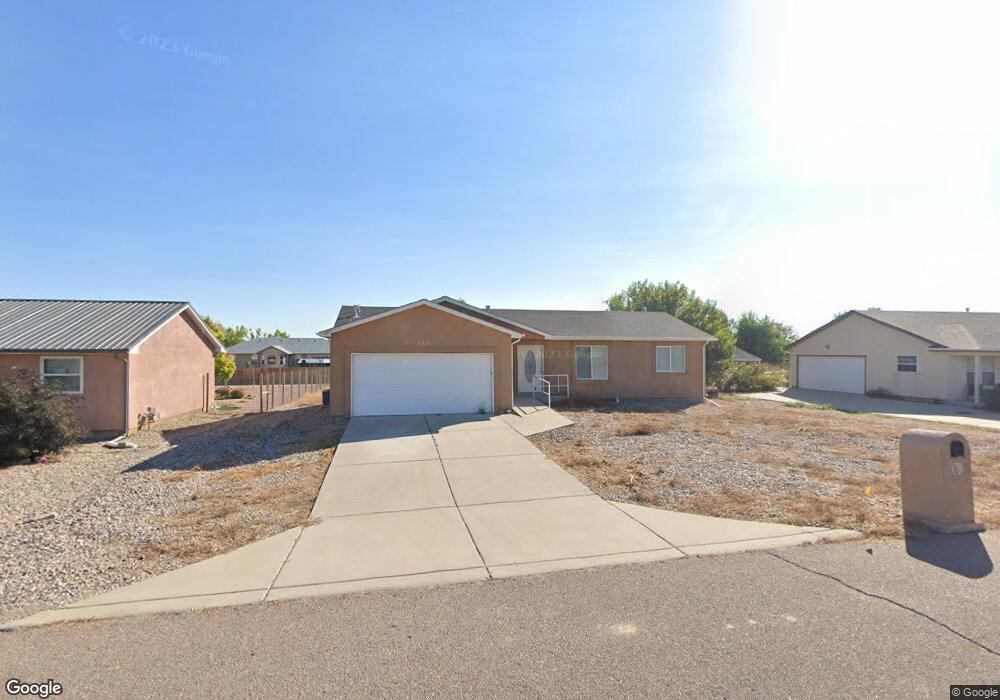
554 S Bond Dr Unit 8 Pueblo, CO 81007
Estimated Value: $316,944 - $328,000
3
Beds
2
Baths
1,249
Sq Ft
$257/Sq Ft
Est. Value
About This Home
This home is located at 554 S Bond Dr Unit 8, Pueblo, CO 81007 and is currently estimated at $321,486, approximately $257 per square foot. 554 S Bond Dr Unit 8 is a home located in Pueblo County with nearby schools including Liberty Point Elementary School, Liberty Point International School, and Pueblo West High School.
Ownership History
Date
Name
Owned For
Owner Type
Purchase Details
Closed on
Apr 29, 2014
Sold by
Smith Kevin C
Bought by
Moorhead Richard and Goodnight Julie
Current Estimated Value
Home Financials for this Owner
Home Financials are based on the most recent Mortgage that was taken out on this home.
Original Mortgage
$89,925
Outstanding Balance
$68,789
Interest Rate
4.43%
Mortgage Type
New Conventional
Estimated Equity
$252,697
Purchase Details
Closed on
Jun 14, 2007
Sold by
Nielsen Faith E
Bought by
Smith Kevin C
Purchase Details
Closed on
Feb 28, 2000
Sold by
+ F O Osher F E and + F O Nielsen M E
Bought by
Nielsen F E + M E + F O
Purchase Details
Closed on
Feb 1, 2000
Sold by
Osher Grace L
Bought by
+ F O Osher F E and + F O Nielsen M E
Purchase Details
Closed on
May 8, 1986
Sold by
Sher Grace L
Bought by
Osher Grace L
Purchase Details
Closed on
Jul 8, 1974
Sold by
Lawyers Title
Bought by
Osher Grace L
Create a Home Valuation Report for This Property
The Home Valuation Report is an in-depth analysis detailing your home's value as well as a comparison with similar homes in the area
Home Values in the Area
Average Home Value in this Area
Purchase History
| Date | Buyer | Sale Price | Title Company |
|---|---|---|---|
| Moorhead Richard | $119,900 | Fidelity National Title Ins | |
| Smith Kevin C | $16,000 | Landamerica | |
| Smith Kevin C | $16,000 | Landamerica | |
| Nielsen F E + M E + F O | -- | -- | |
| + F O Osher F E | -- | -- | |
| Osher Grace L | -- | -- | |
| Osher Grace L | -- | -- |
Source: Public Records
Mortgage History
| Date | Status | Borrower | Loan Amount |
|---|---|---|---|
| Open | Moorhead Richard | $89,925 |
Source: Public Records
Tax History Compared to Growth
Tax History
| Year | Tax Paid | Tax Assessment Tax Assessment Total Assessment is a certain percentage of the fair market value that is determined by local assessors to be the total taxable value of land and additions on the property. | Land | Improvement |
|---|---|---|---|---|
| 2024 | $1,624 | $16,170 | -- | -- |
| 2023 | $1,643 | $19,860 | $3,350 | $16,510 |
| 2022 | $1,368 | $13,632 | $2,090 | $11,542 |
| 2021 | $1,402 | $14,020 | $2,150 | $11,870 |
| 2020 | $1,215 | $14,020 | $2,150 | $11,870 |
| 2019 | $1,211 | $12,116 | $486 | $11,630 |
| 2018 | $1,060 | $10,597 | $490 | $10,107 |
| 2017 | $1,061 | $10,597 | $490 | $10,107 |
| 2016 | $997 | $9,974 | $716 | $9,258 |
| 2015 | $988 | $9,974 | $716 | $9,258 |
| 2014 | $903 | $9,106 | $796 | $8,310 |
Source: Public Records
Map
Nearby Homes
- 436 S Joe Martinez Blvd
- 576 S Falcon Dr
- 593 S Aguilar Dr
- 629 S Aguilar Dr
- 664 S Dante Dr
- 465 S Falcon Dr
- 613 S Inca Dr
- 715 S Joe Martinez Ln
- 200 E Ohio Dr
- 20 W Bonanza Dr
- 238 E Ohio Dr
- 606 E Inca Dr
- 169 E Bond Dr
- 442 S Del Norte Ave
- 438 S Del Norte Ave
- 41 -47 W Cokedale Dr
- 602 S Del Rio Dr
- 74 E Idaho Springs Dr
- 104 W Idaho Springs Dr
- 53 W Palmer Lake Dr
- 554 S Bond Dr
- 548 S Bond Dr
- 560 S Bond Dr
- 540 S Bond Dr
- 566 S Bond Dr
- 547 S Falcon Dr
- 535 S Falcon Dr
- 535 S Falcon Dr Unit 16
- 551 S Falcon Dr
- 529 S Falcon Dr
- 529 S Falcon Dr Unit 15
- 572 S Bond Dr
- 532 S Bond Dr
- 578 S Bond Dr
- 107 E Calico Dr
- 563 S Falcon Dr
- 84 E Beshoar Dr
- 112 E Calico Dr
- 526 S Bond Dr
- 523 S Falcon Dr