5542 E 15th St Oakland, CA 94621
Seminary NeighborhoodEstimated Value: $455,000 - $525,000
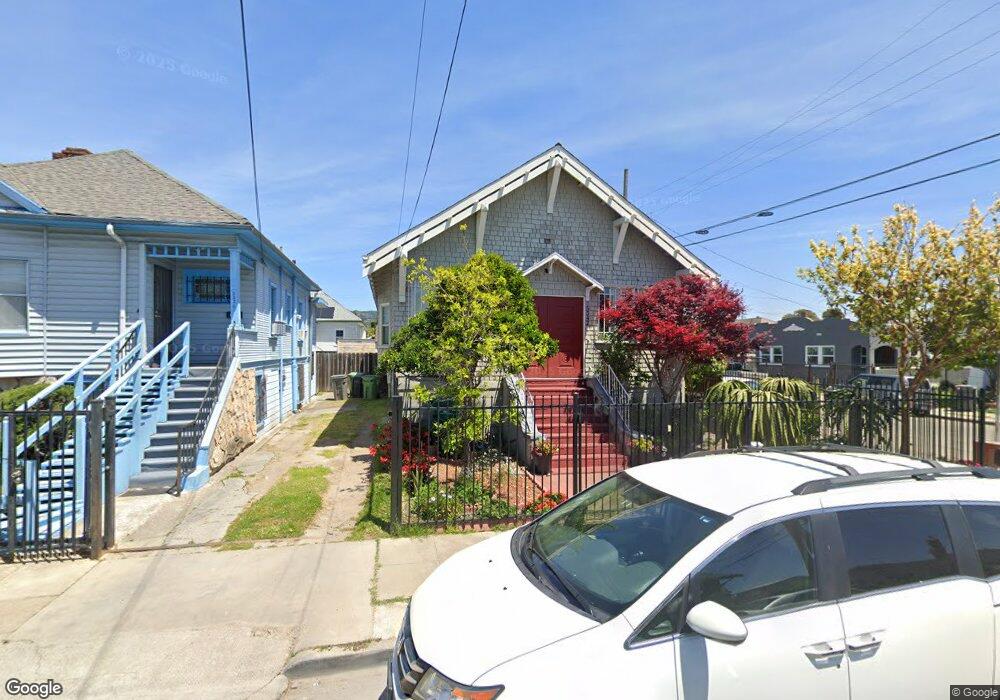
About This Home
This home is located at 5542 E 15th St, Oakland, CA 94621 and is currently estimated at $496,529, approximately $451 per square foot. 5542 E 15th St is a home located in Alameda County with nearby schools including Greenleaf Elementary School, Coliseum College Prep Academy, and Fremont High School.
Ownership History
We collect this data history from publicly available records. To have your information removed, we recommend requesting removal directly through your county’s website.
Purchase Details
Purchase Details
Purchase Details
Home Financials for this Owner
Home Financials are based on the most recent Mortgage that was taken out on this home.Purchase Details
Purchase Details
Home Financials for this Owner
Home Financials are based on the most recent Mortgage that was taken out on this home.Purchase Details
Home Financials for this Owner
Home Financials are based on the most recent Mortgage that was taken out on this home.Purchase Details
Home Financials for this Owner
Home Financials are based on the most recent Mortgage that was taken out on this home.Home Values in the Area
Average Home Value in this Area
Purchase History
We collect this data history from publicly available records. To have your information removed, we recommend requesting removal directly through your county’s website.
| Date | Buyer | Sale Price | Title Company |
|---|---|---|---|
| -- | None Listed On Document | ||
| -- | None Listed On Document | ||
| -- | Chicago Title Company | ||
| $240,000 | Chicago Title Company | ||
| $123,750 | None Available | ||
| $590,000 | Financial Title Company | ||
| -- | Financial Title Company | ||
| $200,000 | Ticor Title Company Of Ca |
Mortgage History
We collect this data history from publicly available records. To have your information removed, we recommend requesting removal directly through your county’s website.
| Date | Status | Borrower | Loan Amount |
|---|---|---|---|
| Previous Owner | $180,000 | ||
| Previous Owner | $472,000 | ||
| Previous Owner | $118,000 | ||
| Previous Owner | $255,000 | ||
| Closed | $100,000 |
Tax History
We collect this data history from publicly available records. To have your information removed, we recommend requesting removal directly through your county’s website.
| Year | Tax Paid | Tax Assessment Tax Assessment Total Assessment is a certain percentage of the fair market value that is determined by local assessors to be the total taxable value of land and additions on the property. | Land | Improvement |
|---|---|---|---|---|
| 2025 | $5,588 | $302,775 | $92,932 | $216,843 |
| 2024 | $5,588 | $296,703 | $91,110 | $212,593 |
| 2023 | $5,787 | $290,748 | $89,324 | $208,424 |
| 2022 | $5,687 | $291,911 | $87,573 | $204,338 |
| 2021 | $5,349 | $286,190 | $85,857 | $200,333 |
| 2020 | $5,289 | $283,257 | $84,977 | $198,280 |
| 2019 | $5,034 | $277,703 | $83,311 | $194,392 |
| 2018 | $4,933 | $272,260 | $81,678 | $190,582 |
| 2017 | $4,724 | $266,922 | $80,076 | $186,846 |
| 2016 | $4,515 | $261,690 | $78,507 | $183,183 |
| 2015 | $4,489 | $257,761 | $77,328 | $180,433 |
| 2014 | $4,479 | $252,714 | $75,814 | $176,900 |
Map
- 1506 55th Ave
- 5533 Edgerly St
- 5745 Holway Ct
- 1515 54th Ave
- 2007 57th Ave
- 5917 International Blvd
- 1447 53rd Ave
- 1301 60th Ave
- 1610 52nd Ave
- 1363 61st Ave
- 1436 52nd Ave
- 1826 Vicksburg Ave Unit 1
- 5116 Bancroft Ave
- 5315 Cole St
- 1517 51st Ave
- 1914 51st Ave
- 1151 58th Ave
- 5955 Hayes St
- 1243 62nd Ave
- 1181 60th Ave
Ask me questions while you tour the home.