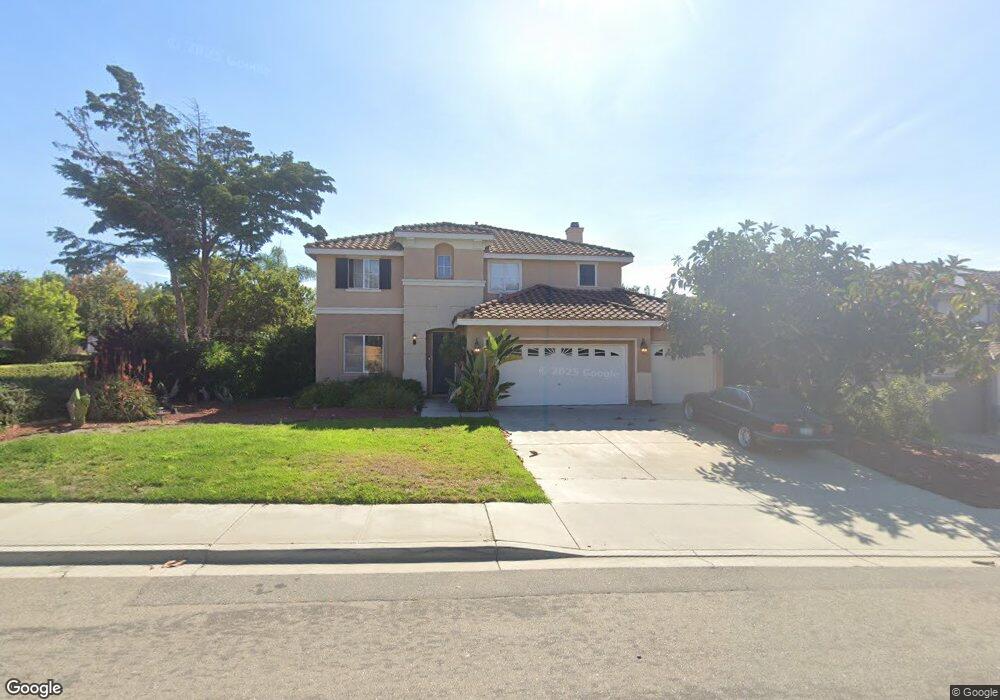
5543 Nanday Ct Unit 3 Oceanside, CA 92057
North Valley NeighborhoodEstimated Value: $1,070,641 - $1,165,000
5
Beds
3
Baths
2,873
Sq Ft
$391/Sq Ft
Est. Value
About This Home
This home is located at 5543 Nanday Ct Unit 3, Oceanside, CA 92057 and is currently estimated at $1,123,160, approximately $390 per square foot. 5543 Nanday Ct Unit 3 is a home located in San Diego County with nearby schools including Bonsall West Elementary School, Sullivan Middle School, and Bonsall High.
Ownership History
Date
Name
Owned For
Owner Type
Purchase Details
Closed on
Apr 22, 2022
Sold by
James Love Jr Willie
Bought by
Love Willie James
Current Estimated Value
Home Financials for this Owner
Home Financials are based on the most recent Mortgage that was taken out on this home.
Original Mortgage
$383,500
Outstanding Balance
$306,895
Interest Rate
3.39%
Mortgage Type
New Conventional
Estimated Equity
$816,265
Purchase Details
Closed on
Aug 29, 2002
Sold by
Kb Home Coastal Inc
Bought by
Love Jr Willie James
Home Financials for this Owner
Home Financials are based on the most recent Mortgage that was taken out on this home.
Original Mortgage
$311,250
Interest Rate
6.16%
Create a Home Valuation Report for This Property
The Home Valuation Report is an in-depth analysis detailing your home's value as well as a comparison with similar homes in the area
Home Values in the Area
Average Home Value in this Area
Purchase History
| Date | Buyer | Sale Price | Title Company |
|---|---|---|---|
| Love Willie James | -- | Boston National Title Agency | |
| Love Jr Willie James | $386,500 | First American Title |
Source: Public Records
Mortgage History
| Date | Status | Borrower | Loan Amount |
|---|---|---|---|
| Open | Love Willie James | $383,500 | |
| Previous Owner | Love Jr Willie James | $311,250 | |
| Closed | Love Jr Willie James | $74,900 |
Source: Public Records
Tax History
| Year | Tax Paid | Tax Assessment Tax Assessment Total Assessment is a certain percentage of the fair market value that is determined by local assessors to be the total taxable value of land and additions on the property. | Land | Improvement |
|---|---|---|---|---|
| 2025 | $5,830 | $559,305 | $246,207 | $313,098 |
| 2024 | $5,830 | $548,339 | $241,380 | $306,959 |
| 2023 | $5,701 | $537,589 | $236,648 | $300,941 |
| 2022 | $5,529 | $527,049 | $232,008 | $295,041 |
| 2021 | $5,427 | $516,715 | $227,459 | $289,256 |
| 2020 | $5,383 | $511,418 | $225,127 | $286,291 |
| 2019 | $5,281 | $501,391 | $220,713 | $280,678 |
| 2018 | $5,305 | $491,561 | $216,386 | $275,175 |
| 2017 | $70 | $481,924 | $212,144 | $269,780 |
| 2016 | $5,076 | $472,476 | $207,985 | $264,491 |
| 2015 | $4,996 | $465,380 | $204,861 | $260,519 |
| 2014 | $4,828 | $450,000 | $198,000 | $252,000 |
Source: Public Records
Map
Nearby Homes
- 1120 Championship Rd
- 5450 Alexandrine Ct
- 0 Wilshire Rd
- 1241 Breakaway Dr
- 1113 Teal Way
- 1061 Boulder Place
- 1039 Eliot St
- 1486 Puritan Way
- 1447 Puritan Dr
- 1247 Bellingham Dr
- 1438 Salem Ct
- 1479 Puritan Dr
- 5168 Indian Ct
- 5164 Indian Ct
- 5116 Weymouth Way
- 868 Panella Ct
- 290 Hadley Way
- 276 Paxton Way
- 671 Parker St
- 656 Parker St
- 5539 Nanday Ct
- 5539 Nanday Ct Unit 3
- 5519 Papagallo Dr
- 5526 Nanday Ct
- 5535 Nanday Ct Unit 3
- 5522 Nanday Ct
- 5523 Papagallo Dr
- 5547 Nanday Ct
- 3504 Cockatoo Ct
- 5528 Nanday Ct
- 5531 Nanday Ct
- 5527 Papagallo Dr
- 5549 Nanday Ct
- 5518 Nanday Ct
- 3508 Cockatoo Ct
- 5532 Nanday Ct
- 5530 Nanday Ct
- 5515 Papagallo Dr
- 5527 Nanday Ct
- 5551 Nanday Ct
Your Personal Tour Guide
Ask me questions while you tour the home.