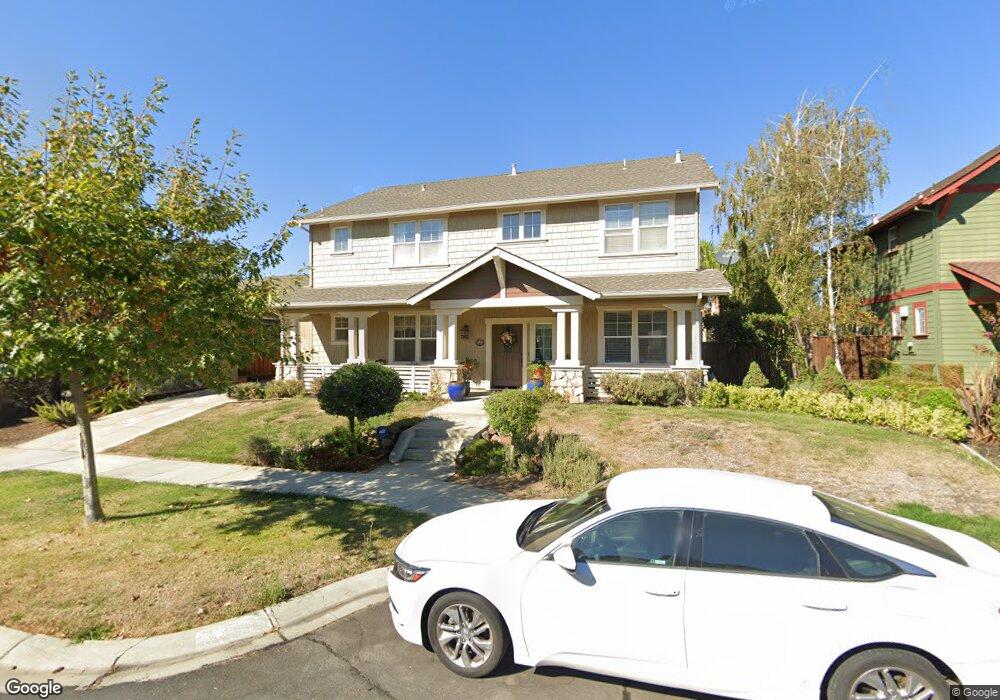
5545 Carnegie Loop Livermore, CA 94550
Dunsmuir NeighborhoodEstimated Value: $1,739,000 - $2,083,000
6
Beds
3
Baths
3,522
Sq Ft
$556/Sq Ft
Est. Value
About This Home
This home is located at 5545 Carnegie Loop, Livermore, CA 94550 and is currently estimated at $1,957,393, approximately $555 per square foot. 5545 Carnegie Loop is a home located in Alameda County with nearby schools including Arroyo Seco Elementary School, East Avenue Middle School, and Livermore High School.
Ownership History
Date
Name
Owned For
Owner Type
Purchase Details
Closed on
Nov 14, 2017
Sold by
Rios Max S
Bought by
Rios Max S and The Max S Rios Revocable Trust
Current Estimated Value
Purchase Details
Closed on
Jan 23, 2015
Sold by
Quinones Latoni Luis A Cabassa and Quinones Murphy Myrna M
Bought by
Rios Max S
Purchase Details
Closed on
Mar 18, 2006
Sold by
Cabassa Luis A and Quinones Myrna M
Bought by
Quinones Latoni Luis A Cabassa and Quinones Murphy Myrna M
Purchase Details
Closed on
Feb 22, 2002
Sold by
Signature Properties Inc
Bought by
Cabassa Luis A and Quinones Myrna M
Home Financials for this Owner
Home Financials are based on the most recent Mortgage that was taken out on this home.
Original Mortgage
$575,900
Interest Rate
6.8%
Purchase Details
Closed on
May 8, 2001
Sold by
Wente Bros
Bought by
Signature Properties Inc
Home Financials for this Owner
Home Financials are based on the most recent Mortgage that was taken out on this home.
Original Mortgage
$3,000,000
Interest Rate
6.89%
Mortgage Type
Construction
Create a Home Valuation Report for This Property
The Home Valuation Report is an in-depth analysis detailing your home's value as well as a comparison with similar homes in the area
Home Values in the Area
Average Home Value in this Area
Purchase History
| Date | Buyer | Sale Price | Title Company |
|---|---|---|---|
| Rios Max S | -- | None Available | |
| Rios Max S | $1,050,000 | Chicago Title Company | |
| Quinones Latoni Luis A Cabassa | -- | None Available | |
| Cabassa Luis A | $720,000 | Chicago Title Co | |
| Signature Properties Inc | $5,500,000 | Chicago Title Co |
Source: Public Records
Mortgage History
| Date | Status | Borrower | Loan Amount |
|---|---|---|---|
| Previous Owner | Cabassa Luis A | $575,900 | |
| Previous Owner | Signature Properties Inc | $3,000,000 | |
| Closed | Signature Properties Inc | $14,000,000 | |
| Closed | Cabassa Luis A | $90,000 |
Source: Public Records
Tax History
| Year | Tax Paid | Tax Assessment Tax Assessment Total Assessment is a certain percentage of the fair market value that is determined by local assessors to be the total taxable value of land and additions on the property. | Land | Improvement |
|---|---|---|---|---|
| 2025 | $5,508 | $321,733 | $96,520 | $225,213 |
| 2024 | $5,508 | $315,426 | $94,628 | $220,798 |
| 2023 | $5,398 | $309,242 | $92,773 | $216,469 |
| 2022 | $5,274 | $303,179 | $90,954 | $212,225 |
| 2021 | $5,171 | $297,237 | $89,171 | $208,066 |
| 2020 | $4,990 | $294,189 | $88,257 | $205,932 |
| 2019 | $5,079 | $288,423 | $86,527 | $201,896 |
| 2018 | $4,907 | $282,770 | $84,831 | $197,939 |
| 2017 | $4,690 | $277,226 | $83,168 | $194,058 |
| 2016 | $4,543 | $271,790 | $81,537 | $190,253 |
| 2015 | $11,452 | $925,887 | $265,496 | $660,391 |
| 2014 | $11,268 | $907,755 | $260,297 | $647,458 |
Source: Public Records
Map
Nearby Homes
- 5590 Hopps Ln
- 5454 Stockton Loop
- 5564 Stockton Loop
- 5218 Norma Way
- 5169 Lillian Ct
- 2583 Cooper Cir
- 2410 Robinson Cir
- 2785 Decker Ln
- 1042 Dana Cir
- 980 Lucille St
- 1635 Embassy Cir
- 912 Loyola Way
- 1762 Cheryl Dr
- 907 Hazel St
- 780 Terry Ln
- 838 Hazel St
- 5143 Tesla Rd
- 4115 Freeda Ct
- 4352 Davis Way
- 656 Carla St
- 5523 Carnegie Loop
- 5567 Carnegie Loop
- 5333 Carnegie Loop
- 5339 Carnegie Loop
- 5321 Carnegie Loop
- 5579 Carnegie Loop
- 5511 Carnegie Loop
- 5538 Carnegie Loop
- 5556 Carnegie Loop
- 5319 Carnegie Loop
- 5345 Carnegie Loop
- 5570 Carnegie Loop
- 5502 Carnegie Loop
- 5631 Carnegie Loop
- 5663 Carnegie Loop
- 2055 Hearst St
- 5489 Carnegie Loop
- 5695 Carnegie Loop
- 5494 Carnegie Loop
- 5338 Carnegie Loop
Your Personal Tour Guide
Ask me questions while you tour the home.