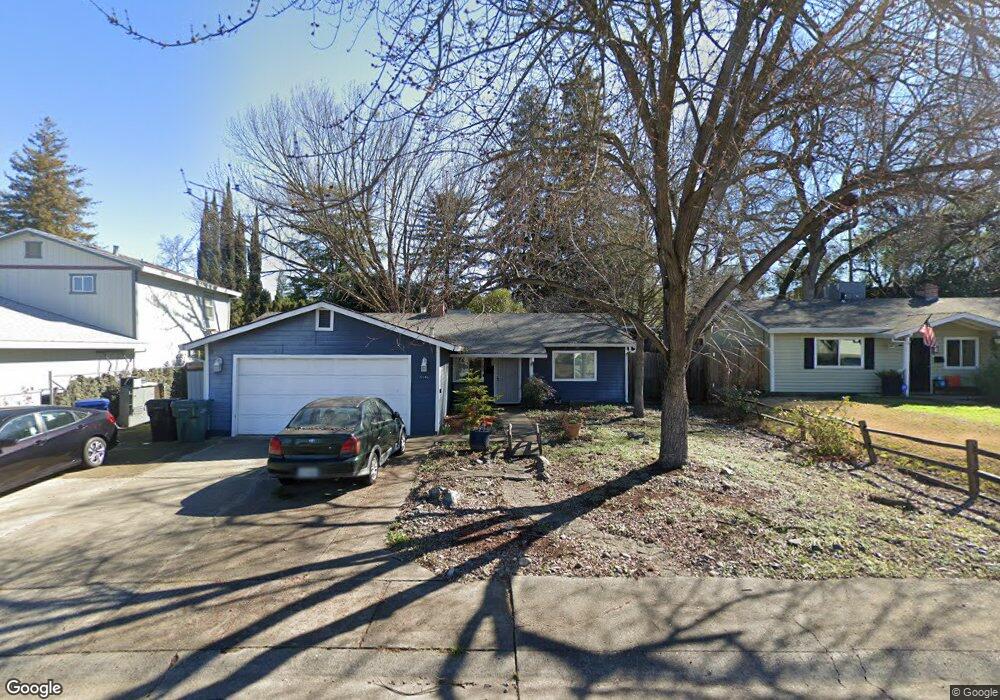
5546 Bellingham Way Orangevale, CA 95662
Estimated Value: $399,000 - $553,000
3
Beds
1
Bath
1,885
Sq Ft
$268/Sq Ft
Est. Value
About This Home
This home is located at 5546 Bellingham Way, Orangevale, CA 95662 and is currently estimated at $505,146, approximately $267 per square foot. 5546 Bellingham Way is a home located in Sacramento County with nearby schools including Pershing Elementary School, Andrew Carnegie Middle School, and Bella Vista High School.
Ownership History
Date
Name
Owned For
Owner Type
Purchase Details
Closed on
Sep 19, 2018
Sold by
Jamison Mcclung Steven Brown and Jamison Mc Clung Denneal
Bought by
Mcclung Beth Anne and Mc Clung Ii Robert E
Current Estimated Value
Home Financials for this Owner
Home Financials are based on the most recent Mortgage that was taken out on this home.
Original Mortgage
$303,403
Interest Rate
4.87%
Mortgage Type
FHA
Purchase Details
Closed on
Jan 27, 2003
Sold by
Lee Roger N and Lee Donna L
Bought by
Brown Mcclung Steven and Jamison Mcclung Denneal
Home Financials for this Owner
Home Financials are based on the most recent Mortgage that was taken out on this home.
Original Mortgage
$222,900
Interest Rate
5.83%
Mortgage Type
VA
Create a Home Valuation Report for This Property
The Home Valuation Report is an in-depth analysis detailing your home's value as well as a comparison with similar homes in the area
Home Values in the Area
Average Home Value in this Area
Purchase History
| Date | Buyer | Sale Price | Title Company |
|---|---|---|---|
| Mcclung Beth Anne | $309,000 | Chicago Title Company | |
| Brown Mcclung Steven | $223,000 | Financial Title Company |
Source: Public Records
Mortgage History
| Date | Status | Borrower | Loan Amount |
|---|---|---|---|
| Previous Owner | Mcclung Beth Anne | $303,403 | |
| Previous Owner | Brown Mcclung Steven | $222,900 |
Source: Public Records
Tax History Compared to Growth
Tax History
| Year | Tax Paid | Tax Assessment Tax Assessment Total Assessment is a certain percentage of the fair market value that is determined by local assessors to be the total taxable value of land and additions on the property. | Land | Improvement |
|---|---|---|---|---|
| 2025 | $4,431 | $379,272 | $78,084 | $301,188 |
| 2024 | $4,431 | $371,836 | $76,553 | $295,283 |
| 2023 | $4,318 | $364,546 | $75,052 | $289,494 |
| 2022 | $4,294 | $357,399 | $73,581 | $283,818 |
| 2021 | $4,222 | $350,392 | $72,139 | $278,253 |
| 2020 | $4,143 | $346,800 | $71,400 | $275,400 |
| 2019 | $4,059 | $340,000 | $70,000 | $270,000 |
| 2018 | $3,494 | $283,713 | $63,635 | $220,078 |
| 2017 | $3,461 | $278,151 | $62,388 | $215,763 |
| 2016 | $3,235 | $272,698 | $61,165 | $211,533 |
| 2015 | $3,181 | $268,603 | $60,247 | $208,356 |
| 2014 | $3,115 | $263,342 | $59,067 | $204,275 |
Source: Public Records
Map
Nearby Homes
- 9172 Madison Green Ln Unit 49
- 9215 Madison Ave
- 9160 Madison Ave Unit 57
- 9160 Madison Ave Unit 44
- 9237 Madison Ave
- 9058 Leedy Ln
- 5401 Norway Dr
- 9196 Rolling Tree Ln
- 9260 Castlemont Cir
- 5607 Walnut Ave Unit 10
- 5312 Tall Oak Ln
- 8905 Leedy Ln
- 5601 Walnut Ave Unit 4
- 5245 Vought Dr
- 9150 Green Ravine Ln
- 9017 Phoenix Ave
- 5933 Filbert Ave
- 9065 Approach Ct
- 8954 Phoenix Ave
- 8906 Aksarben Dr
- 5542 Bellingham Way
- 5550 Bellingham Way
- 5538 Bellingham Way
- 5523 Skyridge Dr
- 5542 Chauncey Way
- 5547 Bellingham Way
- 5543 Bellingham Way
- 5536 Chauncey Way
- 5539 Bellingham Way
- 5532 Bellingham Way
- 5519 Skyridge Dr
- 5524 Skyridge Dr
- 5600 Greenacres Way
- 5530 Chauncey Way
- 5535 Skyridge Dr
- 5520 Skyridge Dr
- 9125 Sutton Way
- 5515 Skyridge Dr
- 9132 Sutton Way
- 5604 Greenacres Way