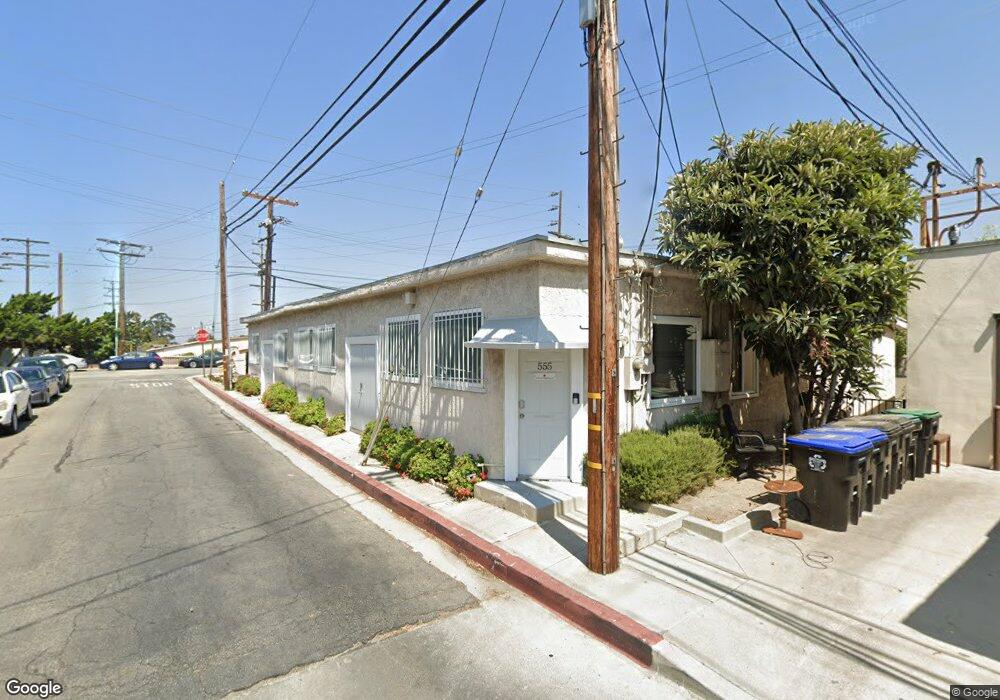
555 Arden Ave Glendale, CA 91203
Glenwood NeighborhoodEstimated Value: $836,984
Studio
--
Bath
1,980
Sq Ft
$423/Sq Ft
Est. Value
About This Home
This home is located at 555 Arden Ave, Glendale, CA 91203 and is currently estimated at $836,984, approximately $422 per square foot. 555 Arden Ave is a home located in Los Angeles County with nearby schools including Balboa Elementary School, Eleanor J. Toll Middle School, and Herbert Hoover High School.
Ownership History
Date
Name
Owned For
Owner Type
Purchase Details
Closed on
Sep 1, 2020
Sold by
Johanson Niles W and Toula Johanson P
Bought by
555 Arden Ave Llc
Current Estimated Value
Home Financials for this Owner
Home Financials are based on the most recent Mortgage that was taken out on this home.
Original Mortgage
$552,500
Outstanding Balance
$490,307
Interest Rate
2.9%
Mortgage Type
Construction
Estimated Equity
$346,677
Purchase Details
Closed on
Sep 19, 2013
Sold by
555 Arden Llc
Bought by
Johanson Niles W and Toula Johanson P
Purchase Details
Closed on
Apr 12, 2000
Sold by
Thomassian Mike V and Thomassian Magda
Bought by
Thomassian Mike V and Thomassian Magda
Purchase Details
Closed on
Dec 1, 1999
Sold by
Family Trust Poquette Ray G And Irene Trs Poq
Bought by
Thomassian Mike V and Thomassian Magda
Home Financials for this Owner
Home Financials are based on the most recent Mortgage that was taken out on this home.
Original Mortgage
$126,000
Interest Rate
7.82%
Mortgage Type
Commercial
Create a Home Valuation Report for This Property
The Home Valuation Report is an in-depth analysis detailing your home's value as well as a comparison with similar homes in the area
Home Values in the Area
Average Home Value in this Area
Purchase History
| Date | Buyer | Sale Price | Title Company |
|---|---|---|---|
| 555 Arden Ave Llc | $650,000 | Old Republic Title Co | |
| Johanson Niles W | $450,000 | Old Republic Title Co | |
| Thomassian Mike V | -- | -- | |
| Thomassian Mike V | $140,000 | Equity Title Company |
Source: Public Records
Mortgage History
| Date | Status | Borrower | Loan Amount |
|---|---|---|---|
| Open | 555 Arden Ave Llc | $552,500 | |
| Previous Owner | Thomassian Mike V | $126,000 |
Source: Public Records
Tax History
| Year | Tax Paid | Tax Assessment Tax Assessment Total Assessment is a certain percentage of the fair market value that is determined by local assessors to be the total taxable value of land and additions on the property. | Land | Improvement |
|---|---|---|---|---|
| 2025 | $7,752 | $703,580 | $422,148 | $281,432 |
| 2024 | $7,752 | $689,785 | $413,871 | $275,914 |
| 2023 | $7,577 | $676,260 | $405,756 | $270,504 |
| 2022 | $7,445 | $663,000 | $397,800 | $265,200 |
| 2021 | $7,313 | $650,000 | $390,000 | $260,000 |
| 2020 | $5,702 | $504,397 | $280,221 | $224,176 |
| 2019 | $5,566 | $494,508 | $274,727 | $219,781 |
| 2018 | $5,441 | $484,813 | $269,341 | $215,472 |
| 2016 | $5,181 | $465,989 | $258,883 | $207,106 |
| 2015 | $5,076 | $458,991 | $254,995 | $203,996 |
| 2014 | $5,032 | $450,000 | $250,000 | $200,000 |
Source: Public Records
Map
Nearby Homes
- 409 Burchett St Unit 220
- 409 Burchett St Unit 210
- 608 Pioneer Dr
- 350 Burchett St Unit 101
- 343 Pioneer Dr Unit 1101
- 570 W Stocker St
- 1151 N Columbus Ave
- 706 W Doran St
- 543 W Stocker St Unit 5
- 250 W Fairview Ave Unit 301
- 0 N Idlewood Rd
- 1207 N Columbus Ave
- 806 Burchett St
- 516 W Lexington Dr
- 1230 Dorothy Dr
- 333 Milford St Unit 105
- 1236 N Columbus Ave Unit 16
- 302 W Loraine St Unit 4
- 330 Concord St Unit A
- 1201 Viola Ave Unit 104
- 556 Arden Ave
- 818 N Kenilworth Ave
- 547 Arden Ave
- 888 N Kenilworth Ave
- 814 N Kenilworth Ave
- 540 Arden Ave
- 909 N Kenilworth Ave Unit 1/2
- 600 Arden Ave
- 541 Hahn Ave
- 536 Arden Ave
- 543 Arden Ave
- 537 Hahn Ave
- 610 Arden Ave
- 546 Hahn Ave
- 603 Arden Ave
- 529 Hahn Ave
- 806 N Kenilworth Ave Unit 2
- 543 Burchett St
- 806 N Kenilworth Ave
- 537 Burchett St
Your Personal Tour Guide
Ask me questions while you tour the home.