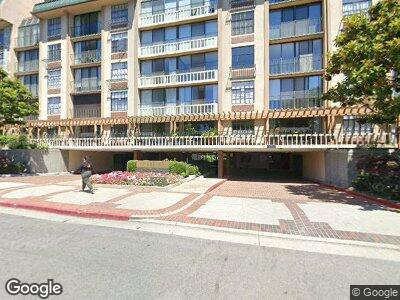
Gramercy On the Park 555 Laurel Ave Unit 322 San Mateo, CA 94401
Downtown San Mateo NeighborhoodEstimated Value: $1,260,318 - $1,717,000
2
Beds
2
Baths
1,786
Sq Ft
$785/Sq Ft
Est. Value
About This Home
This home is located at 555 Laurel Ave Unit 322, San Mateo, CA 94401 and is currently estimated at $1,402,080, approximately $785 per square foot. 555 Laurel Ave Unit 322 is a home located in San Mateo County with nearby schools including Sunnybrae Elementary School, Borel Middle School, and Aragon High School.
Ownership History
Date
Name
Owned For
Owner Type
Purchase Details
Closed on
Jan 17, 2021
Sold by
Sotir George A and Sotir Elaine
Bought by
Sotir George A and Sotir Elaine
Current Estimated Value
Purchase Details
Closed on
Dec 9, 2010
Sold by
Corley Marcus L
Bought by
Sotir George A and Sotir Elaine
Purchase Details
Closed on
May 24, 2007
Sold by
Hwang Wenglong Hwang and Hwang Wu Jyh Yeh
Bought by
Corley Marcus L
Home Financials for this Owner
Home Financials are based on the most recent Mortgage that was taken out on this home.
Original Mortgage
$600,000
Interest Rate
6.16%
Mortgage Type
Purchase Money Mortgage
Purchase Details
Closed on
Nov 17, 2004
Sold by
Harnett Joyce
Bought by
Hwang Wenglong Hwang and Hwang Wu Jyh Yeh
Purchase Details
Closed on
Nov 20, 2002
Sold by
Harnett Joyce R
Bought by
Harnett Joyce
Create a Home Valuation Report for This Property
The Home Valuation Report is an in-depth analysis detailing your home's value as well as a comparison with similar homes in the area
Home Values in the Area
Average Home Value in this Area
Purchase History
| Date | Buyer | Sale Price | Title Company |
|---|---|---|---|
| Sotir George A | -- | None Available | |
| Sotir George A | -- | None Available | |
| Sotir George A | $775,000 | North American Title Co Inc | |
| Corley Marcus L | $975,000 | North American Title Company | |
| Hwang Wenglong Hwang | $720,000 | Cornerstone Title Company | |
| Harnett Joyce | -- | -- |
Source: Public Records
Mortgage History
| Date | Status | Borrower | Loan Amount |
|---|---|---|---|
| Previous Owner | Corley Marcus L | $610,000 | |
| Previous Owner | Corley Marcus L | $600,000 | |
| Previous Owner | Harnett Joyce | $185,000 |
Source: Public Records
Tax History Compared to Growth
Tax History
| Year | Tax Paid | Tax Assessment Tax Assessment Total Assessment is a certain percentage of the fair market value that is determined by local assessors to be the total taxable value of land and additions on the property. | Land | Improvement |
|---|---|---|---|---|
| 2023 | $7,025 | $510,547 | $106,440 | $404,107 |
| 2022 | $6,809 | $500,537 | $104,353 | $396,184 |
| 2021 | $6,619 | $490,723 | $102,307 | $388,416 |
| 2020 | $6,249 | $485,692 | $101,258 | $384,434 |
| 2019 | $6,198 | $476,170 | $99,273 | $376,897 |
| 2018 | $5,866 | $466,834 | $97,327 | $369,507 |
| 2017 | $5,600 | $457,681 | $95,419 | $362,262 |
| 2016 | $5,347 | $448,708 | $93,549 | $355,159 |
| 2015 | $5,247 | $441,969 | $92,144 | $349,825 |
| 2014 | $5,139 | $433,313 | $90,340 | $342,973 |
Source: Public Records
About Gramercy On the Park
Map
Nearby Homes
- 555 Laurel Ave Unit 330
- 555 Laurel Ave Unit 527
- 808 Laurel Ave Unit 104
- 222 8th Ave Unit 302
- 821 Laurel Ave Unit 7
- 20 W 3rd Ave Unit 202
- 40 W 3rd Ave Unit 603
- 10 Crystal Springs Rd Unit 1502
- 10 Crystal Springs Rd Unit 1405
- 10 Crystal Springs Rd Unit 1206
- 10 Crystal Springs Rd Unit 2214
- 38 Crystal Springs Rd Unit 4
- 117 W 3rd Ave
- 1003 S B St
- 703 2nd Ave
- 21 S Claremont St Unit 1
- 1 Baldwin Ave Unit 509
- 1 Baldwin Ave Unit 903
- 1 Baldwin Ave Unit 709
- 1 Baldwin Ave Unit 616
- 555 Laurel Ave Unit 322
- 555 Laurel Ave Unit 317
- 555 Laurel Ave Unit 128
- 555 Laurel Ave Unit 420
- 555 Laurel Ave
- 555 Laurel Ave Unit 615
- 555 Laurel Ave Unit 614
- 555 Laurel Ave Unit 613
- 555 Laurel Ave Unit 612
- 555 Laurel Ave Unit 611
- 555 Laurel Ave Unit 610
- 555 Laurel Ave Unit 608
- 555 Laurel Ave Unit 607
- 555 Laurel Ave Unit 606
- 555 Laurel Ave Unit 605
- 555 Laurel Ave Unit 604
- 555 Laurel Ave Unit 603
- 555 Laurel Ave Unit 414
- 555 Laurel Ave Unit 413
- 555 Laurel Ave Unit 412